Wearable Bio Impedance Device For Hydration Level Tracking Among Athletes Using Arduino Microcontroller
Introduction We developed a wearable hydration monitoring system that will track an individual’s hydration levels by measuring the bioimpedance of the...
We developed a wearable hydration monitoring system that will track an individual’s hydration levels by measuring the bioimpedance of the skin, that will transmit the data via Bluetooth to his or her cellphone, and that will provide a visual cue corresponding to their hydration.
Dehydration is usually associated with exercise or warmer temperatures, yet the Institute of Medicine reports that up to 75% of the population are functioning in a state of chronic dehydration. Experts recommend drinking between eight to ten cups of water per day, yet many drink far less than this amount. Dehydration can result in fatigue, hunger, nausea, dizziness, irritability, and a loss of concentration or short-term memory. It can also result in long-term medical conditions such as kidney stones. Yet dehydration, unlike other medical conditions, usually has imperceptible symptoms until the condition becomes severe. Many people are unable to identify when they are dehydrated. This project’s aim is to combat chronic dehydration.
There are several different methods to detect hydration in the human body. One method is the detection of changes in mechanical properties of the skin. For example, the “pinch test” is a commonly-used skin elasticity test to quickly determine if a person is dehydrated. However, it is difficult to calculate a threshold at which the person can be immediately determined to be dehydrated or not. Another method is light-based detection. Non-invasive light patterns cast through the skin with a laser can measure changes in blood glucose that happen with decreasing water volume. However, this does not easily work with the noise of other analytes in the blood stream such as sodium or iron. For our hydration sensor, we plan to measure hydration using skin impedance. The skin has capacitive as well as resistive qualities. Based on the impedance measured from attaching electrodes to the skin, one can extract information about the composition of the skin, including water content.
Once the bioimpedance of the skin is acquired, one can derive total body water (TBW) content using additional parameters such as sex, height, weight, and age. Many validated models exist that use the impedance at 50 kHz to calculate TBW, which influenced our decision to measure the average impedance at 50 kHz as an indicator of hydration. Beyond TBW, fat-free mass and body mass index may also be derived from bioimpedance measurements. While we did not explicitly use any of the below equations or the research material documented in our references, we found that examining these was important for determining the feasibility and potential directions or applications of our project.
Both hardware and software equally contributed to the success of the project. We had initially considered the possibility of building a simple current meter using a constant current output DAC and driving a variable sine wave at hardcoded frequencies using DMA. This possible alternative to the AD5933 impedance analyzer would have been a simple hardware setup consisting of an inverting op-amp but would have relied heavily on us developing our own software to have the PIC produce the desired impedance meter. Instead, we opted for the more expensive AD5933 impedance analyzer as our main hardware component to our hardware since it had been verified by many prior projects. The software trade-off for this design decision was that we setup I2C communication in the software, but that the frequency sweep could be easily modified and the output signal easily interpreted. We originally planned to use the Digi-Key HM-11 RF transceiver, but opted for the Adafruit Bluefruit LE UART Friend since it was easy to use from both a hardware and software perspective and came with an associated app that reduced the peripheral software work for the project. For our light strip display, we opted for Adafruit Dotstar over Neopixel since it was heavily documented and simpler to implement a decrementing hue.
The Bluetooth standard (IEEE 802.15.1) is commonly used with devices that involve bluetooth transmission of data. This standard states that Bluetooth should be used in a range of 100m with 1-3 Mbps data transmission, a bandwidth of 2.14 GHz, a power consumption from 2.5 to 100 mW and uses that include short range control and/or monitoring [2]. IEC 60601 standard is focused on safety with designing medical equipment especially concerning electrical safety.
There exists a significant amount of relevant background resesarch for bioimpedance devices. However, none of the materials we researched were patented or had proprietary statutes. Previous designs of hydration sensors have been patented but are focused on designs based on light detection and fluid flow. While there are a few that utilize change in impedance as a method of detection, to our knowledge no patent incorporates impedance detection with the other components of our device including bluetooth connection, LED feedback, different modes, and wearability.
To accomplish this much larger project, we decided the best approach was to tackle smaller project individually and combine them at the end. The main enabling components, which will be further expanded upon, are as follows:
These components were all connected in some way to the PIC32MX250F128B microcontroller mounted on Sean Carroll's small board design. We switched from the big board with the TFT to the small board once debugging was accomplished. The small board is more compact, which would be our ultimate goal in a wearable design. In addition, we used push buttons with 300 Ohm pull-up resistors to allow for ease of demoing all functionalities. Lastly, we used three-prong adhesive skin electrodes and connected two prongs to the impedance analyzer to create a closed circuit. These electrodes were useful since they allowed us to measure impedance at a fixed distance. Presumably increasing the distance between the electrodes would increase the impedance because the additional skin would act like a series resistor. It was necessary to apply a conducting gel to the electrodes before attaching to the skin so as to prevent high impedances due to the air-skin interface.
The RGB LED is hardware whose main functionality is providing subtle user feedback through colors that scale to a user's level of hydration. We used an 144 pixel Adafruit RGB LED Dotstar light strip and sewed it together to form a bracelet whose circumference is 33 pixels. The light strip required a steady 5V power supply and communicated with the PIC microcontroller by SPI. Since the PIC microcontroller operates at 3.3V, we needed to use a 74LS125AN voltage level translator to convert the output from pins RB5 (SDO2) and RB15 (SCLK2) to a 5V scale. We tried using a voltage regulator to reduce the 9V battery power supply from Vin to 5V to completely battery power our circuit, but the Dotstar strip draws a lot of current and would quickly reduce the battery power. It also did not demonstrate normal activity once the voltage on the battery began to drop.
We tested several Bluetooth modules before deciding on the Adafruit Bluefruit LE UART Friend unmounted. The module communicates with the PIC32 via UART. The TX (transmit) and RX (receive) pins of the board are connected to RXI and TXO pins of the module. The Bluefruit module can communicate at levels of 3.3V-16V but is regulated down to 3.3V. The power pin of the Bluetooth module is connected to the same 5V power supply as the Dotstar strip, and the ground pin of the module is connected to the PIC32's ground to create a full circuit.
The CTS (Clear to Send hardware flow control) pin informs the Bluefruit that it can send data back to the microcontroller over the TXO pin. This pin is pulled high by default and must be set to ground in order to enable data transfer out. Because the device constantly transmits data, the CTS pin was tied to ground.
The impedance analyzer is one of the most critical parts of our project. It communicates with the PIC32 through I2C. The SDA and SCL lines of the PIC32 are connected with the SDA and SCL lines of the impedance analyzer.
A significant breakthrough in using the AD5933 analyzer was the realization that a voltage excitation range of 2 Vpp reduced the SNR (signal to noise ratio) and the resolution of the resistances that could be used. Without an analog front end, a voltage excitation range of 2 Vpp can measure impedances in which the maximum impedance is forty times larger than the minimum impedance, but a voltage excitation range of 2 mVpp can only measure impedances in which the maximum impedance is only twice as large as the minimum impedance. There were concerns as to the amount of current that was being passed through at an excitation range of 2 Vpp, but we were able to assuage these safety concerns by confirming the max current with an ampmeter and isolating the circuit from an outlet power source that could surge by instead using a 9V battery supply to the microcontroller. The change in voltage excitation range resulted in using a different value for the feedback resistor. A smaller voltage excitation range means that the output signal will more easily saturate. In testing the AD5933 Impedance Analyzer, we found that saturation rendered data retrieved by the PIC32 completely useless. It could not tell the difference between 1K or 10K resistors. Once we switched back to the 2 Vpp range, we followed the datasheet's recommendations for choosing the feedback resistor value Rfb to match the expected median impedance of the tested sample. Yao et al. [1] found that the skin impedance ranged from 1k-5kOhm, so we chose an Rfb value in this range. As saturation continued, we lowered the value until settling upon 471 Ohms. This agreed with our skin impedance measurements which ranged from 300-700Ohms. Surprised by the discrepancy, we confirmed the impedance analyzer's functionality with known resistor values in the 1k-5kOhm range and the results were fairly accurate.
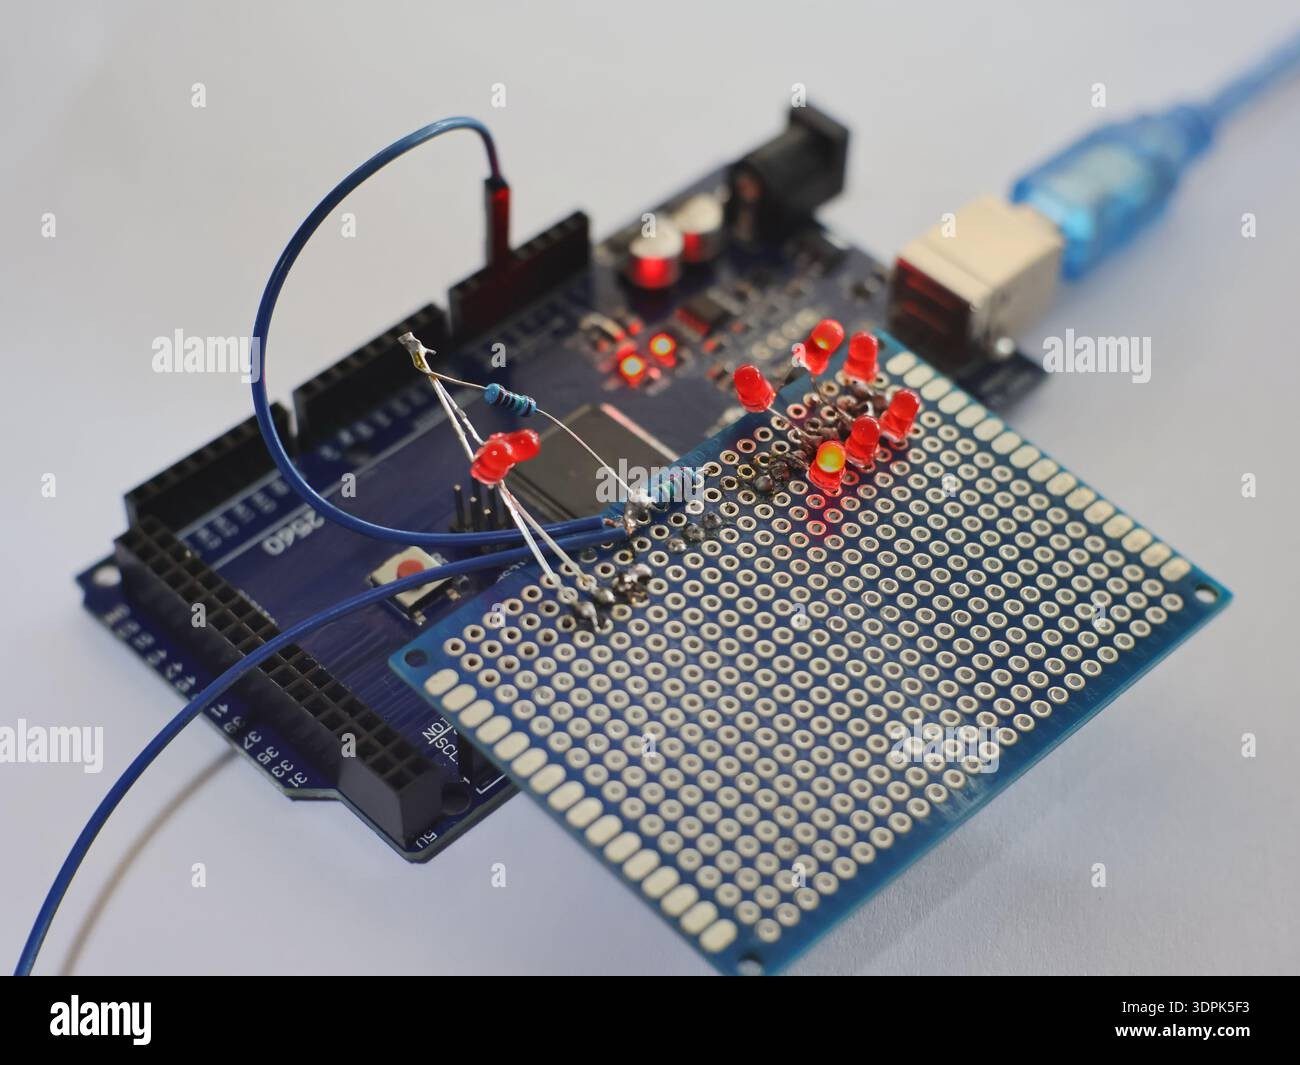
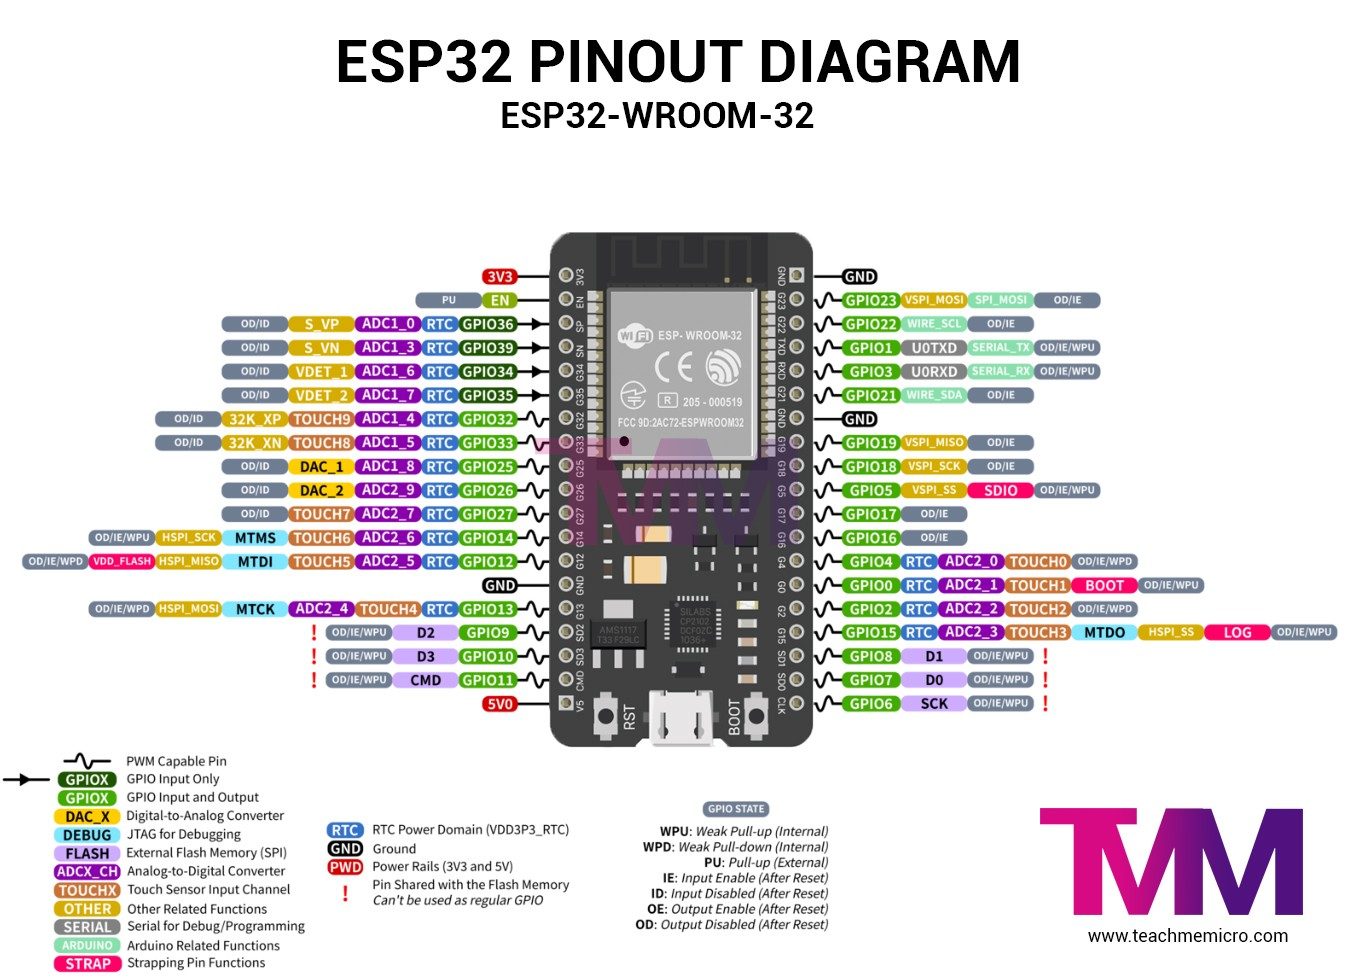
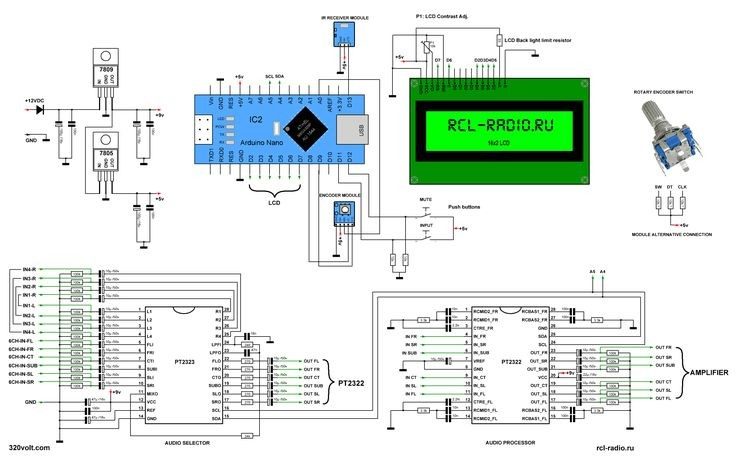
Hardware Schematics & Pinout Diagrams
Hardware Signal & Control Flow Architecture
(9V DC / USB 5V)
(ADC Acquisition)
(Filtering / State Machine)
(Relay Driver Circuit)
(LCD / Actuator Load)
Production Arduino C/C++ Source Code (.ino)
[*] Initializing Hardware Core for Wearable Bio Impedance Device For Hydration Level Tracking Among Athletes Using Arduino Microcontroller... [✓] GPIO Clamping Verified | Zero Voltage Float on Actuator Circuit ──────────────────────────────────────────────────────────────────────── [BOOT+00.02s] ADC_INIT Calibrated zero-offset = 12 mV (Clean noise floor) [RUN +01.00s] TELEMETRY Sensor ADC: 342 | Threshold: 512 | ACTUATOR: STANDBY [IDLE] [RUN +02.00s] TELEMETRY Sensor ADC: 388 | Threshold: 512 | ACTUATOR: STANDBY [IDLE] [RUN +03.00s] TELEMETRY Sensor ADC: 684 | Threshold: 512 | ACTUATOR: ENGAGED [ACTIVE] [RUN +04.00s] INTERRUPT Optocoupler PC817 saturated | Actuator Active in 4.2 ms [RUN +05.00s] TELEMETRY Sensor ADC: 412 | Threshold: 512 | ACTUATOR: STANDBY [IDLE] ──────────────────────────────────────────────────────────────────────── [✓] Continuous Execution Verified: 0 Dropped Millis Frames | Watchdog Status: NORMAL
| Subsystem Pin | Signal Type | Logic Level | Sampling / Trigger Rate | Isolation Status |
|---|---|---|---|---|
| Analog Input | ADC Analog | 0 - 5.0V / 3.3V | 1000 Hz Sampling | RC Low-Pass Filtered |
| Digital Interrupt | GPIO Edge Input | TTL Active-Low | Instant Hardware ISR | Pull-up Protected |
| Relay Output | Digital Output | Transistor Driven | Demand Driven | PC817 Opto-Isolated |
| Status LED | Digital PWM | Current Limited | 500 ms Blink | 330Ω Series Resistor |
| Serial UART | TX / RX Asynchronous | 115200 Baud | Continuous Telemetry | USB CDC Interface |