Tinyml Based Heart Rate Variability Hrv Stress Level Classifier On Embedded Arm Chips
PulseGuard-TinyML is an experimental HRV-based stress classification project using a lightweight Random Forest model to categorize stress levels as Healthy, Caution, or Danger. It explores real-time, on-device machine learning deployment on the ESP32 using TinyML.
PulseGuard-TinyML is a project focused on exploring how Heart Rate Variability (HRV) can be used to identify different stress levels using machine learning.
The idea is to train a lightweight Random Forest model that can classify HRV data into three categories: Healthy, Caution, and Danger . The long-term goal is to run this model directly on an ESP32, making it possible to perform predictions on an edge device without depending on cloud processing.
The project uses a heart-rate/HRV dataset from Kaggle. RR intervals (the time between consecutive heartbeats) are used to obtain relevant HRV features, which are then passed to a trained Random Forest classifier.
The initial focus is on dataset processing, model development, and performance evaluation. ESP32 deployment and integration with live sensor data are part of the development goals.
This is an experimental learning project. Its output is not medically validated and should not be used for medical diagnosis.
Built to explore the intersection of machine learning, embedded systems, and health-related data analysis.
Stress is a psychophysiological condition that requires continuous and objective monitoring. However, existing wearable stress detection systems often rely on cloud-based processing or computationally intensive algorithms, limiting their applicability for real-time inference on resource-constrained embedded devices. This study presents a TinyML-based framework for real-time stress detection using the MAX30102 sensor and an ESP32 microcontroller. The proposed framework integrates four time-domain Heart Rate Variability (HRV) features (BPM, SDNN, RMSSD, and pNN50), a lightweight Deep Neural Network (DNN), full INT8 TensorFlow Lite quantization, and on-device inference to enable efficient edge-based stress classification. The DNN model was trained and evaluated using the WESAD dataset. Experimental results showed that a decision threshold of 0.70 yielded the best classification performance, achieving an accuracy of 82% and an F1-score of 0.63 for the stress class. The quantized TensorFlow Lite INT8 model preserved 100% prediction compatibility between the Python and ESP32 implementations. Furthermore, the MAX30102 sensor achieved a BPM measurement accuracy of 98.74%, while the HRV feature extraction implemented on the ESP32 produced results consistent with the reference calculations. These findings demonstrate that the proposed end-to-end TinyML framework enables accurate and computationally efficient HRV-based stress detection on resource-constrained microcontrollers, providing a practical foundation for real-time wearable edge-health monitoring
[1] Y. Segono, E. Y. M. Hutagalung, H. G. Simbolon, N. I. Us, and A. Ridwan, “IoT-Based Stress Monitoring Using CNN for HRV-GSR Analysis,” Sinkron, vol. 10, no. 1, pp. 621–637, 2026, doi: 10.33395/sinkron.v10i1.15671.
[2] A. Abu-Samah et al., “Deployment of TinyML-Based Stress Classification Using Computational Constrained Health Wearable,” Electron., vol. 14, no. 4, p. 687, Feb. 2025, doi: 10.3390/electronics14040687.
[3] P. Ganesan, Y. R. Thota, H. Shehata, and T. Nikoubin, TinyML Based Stress Detection utilizing PPG Signals: A Lightweight Approach for Smart Wearable Devices, vol. 1, no. 1. Association for Computing Machinery, 2025. doi: 10.1145/3716368.3735274.
[4] A. Calvo, J. Martin, and C. Martin, “Early Detection of Chronic Stress Using Wearable Devices: A Machine Learning Approach with the WESAD Database,” in International Conference on Information and Communication Technologies for Ageing Well and e-Health, ICT4AWE - Proceedings, 2025, pp. 189–196. doi: 10.5220/0013209700003938.
[5] G. Tyulepberdinova, M. Kunelbayev, G. Amirkhanova, M. Tokhtassyn, and A. Amirkhanov, “Development of a Stress Monitoring System Architecture for Heart Rate Measurement,” Eng. Technol. Appl. Sci. Res., vol. 15, no. 6, pp. 29551–29565, 2025, doi: 10.48084/etasr.13150.
[6] R. Al Abdi, S. AlKaabi, S. Elsifi, and J. Yousaf, “Mental Stress Detection Using Physiological Sensors and Artificial Intelligence: A Review,” Sensors, vol. 26, no. 5, pp. 1–31, 2026, doi: 10.3390/s26051616.
[7] A. Pinge, V. Gad, D. Jaisighani, S. Ghosh, and S. Sen, “Detection and monitoring of stress using wearables: a systematic review,” Front. Comput. Sci., vol. 6, no. c, Dec. 2024, doi: 10.3389/fcomp.2024.1478851.
[8] K. M. Dalmeida and G. L. Masala, “HRV Features as Viable Physiological Markers for Stress Detection Using Wearable Devices,” Sensors, vol. 21, no. 8, p. 2873, Apr. 2021, doi: 10.3390/s21082873.
[9] Wadeea Alnufaily, Ramasamy Srinivasagan, Purushothaman R, and Mohammed Alnaeem, “Stress Detection from Photoplethysmography Signals Using Multi-Domain Heart Rate Variability Analysis,” J. Comput. Biomed. Informatics, vol. 10, no. 02, Mar. 2026, doi: 10.56979/1002/2026/1234.
[10] Y. Haque et al., “State-of-the-Art of Stress Prediction from Heart Rate Variability Using Artificial Intelligence,” Cognit. Comput., vol. 16, no. 2, pp. 455–481, Mar. 2024, doi: 10.1007/s12559-023-10200-0.
[11] M. Bahameish, T. Stockman, and J. Requena Carrión, “Strategies for Reliable Stress Recognition: A Machine Learning Approach Using Heart Rate Variability Features,” Sensors, vol. 24, no. 10, pp. 1–21, 2024, doi: 10.3390/s24103210.
[12] Y. Y. Tsai, Y. J. Chen, Y. F. Lin, F. C. Hsiao, C. H. Hsu, and L. De Liao, “Photoplethysmography-based HRV analysis and machine learning for real-time stress quantification in mental health applications,” APL Bioeng., vol. 9, no. 2, pp. 1–22, 2025, doi: 10.1063/5.0256590.
[13] J. A. Mortensen, M. E. Mollov, A. Chatterjee, D. Ghose, and F. Y. Li, “Multi-Class Stress Detection Through Heart Rate Variability: A Deep Neural Network Based Study,” IEEE Access, vol. 11, no. May, pp. 57470–57480, 2023, doi: 10.1109/ACCESS.2023.3274478.
[14] S. Heydari and Q. H. Mahmoud, “Tiny Machine Learning and On-Device Inference: A Survey of Applications, Challenges, and Future Directions,” Sensors, vol. 25, no. 10, 2025, doi: 10.3390/s25103191.
[15] T. F. of the E. S. of C. the N. A. S. of P. Electrophysiology, “Heart rate variability: standards of measurement, physiological interpretation, and clinical use,” Circulation, vol. 93, no. 5, pp. 1043–1065, 1996.
[16] F. Shaffer and J. P. Ginsberg, “An Overview of Heart Rate Variability Metrics and Norms,” Front. Public Heal., vol. 5, no. September, pp. 1–17, 2017, doi: 10.3389/fpubh.2017.00258.
[17] B. Kołakowski, P. Noga, P. Mańczak, and M. Nowak, “Comparative analysis of methods for calculating HRV values on heart rate monitoring devices,” TASK Q., vol. 29, no. 2, 2025.
[18] M. M. Taye, “Understanding of Machine Learning with Deep Learning: Architectures, Workflow, Applications and Future Directions,” Computers, vol. 12, no. 5, p. 91, Apr. 2023, doi: 10.3390/computers12050091.
[19] I. H. Sarker, “Deep Learning: A Comprehensive Overview on Techniques, Taxonomy, Applications and Research Directions,” SN Comput. Sci., vol. 2, no. 6, pp. 1–20, 2021, doi: 10.1007/s42979-021-00815-1.
[20] R. Immonen and T. Hämäläinen, “Tiny Machine Learning for Resource-Constrained Microcontrollers,” J. Sensors, vol. 2022, pp. 1–11, Nov. 2022, doi: 10.1155/2022/7437023.
[21] Schmidt, P., Reiss, A., Duerichen, R., Marberger, C., & Van Laerhoven, K. (2018, October). Introducing wesad, a multimodal dataset for wearable stress and affect detection. In Proceedings of the 20th ACM international conference on multimodal interaction (pp. 400-408).
[22] Van Gent, P., Farah, H., Van Nes, N., & Van Arem, B. (2019). HeartPy: A novel heart rate algorithm for the analysis of noisy signals. Transportation research part F: traffic psychology and behaviour, 66, 368-378.
NUANSA INFORMATIKA : JURNAL TEKNOLOGY DAN INFORMASI (OJS Version 3 in 2023) p-ISSN :1858-3911 , e-ISSN : 2614-5405 DOI : https://doi.org/10.25134/nuansa Accreditation : SINTA 5
Organized by Faculty of Computer Science, Universitas Kuningan, Indonesia. Website OJS2 : https://journal.uniku.ac.id/index.php/ilkom Website OJS3 in 2023: https://journal.fkom.uniku.ac.id/ilkom Email : [email protected] Address : Jalan Cut Nyak Dhien No.36A Kuningan, Jawa Barat, Indonesia.
This page contains resources for the "Developing STEM skills using Arduino and heart rate variability analysis" workshop as presented at the 2018 Deakin STEM Education Conference .
The code provided on this page is intended for educational use only and should not be used for medical purposes.
With the introduction of wearable sensors and the Internet of Things (IoT), the use of physiological signals to continuously assess our mental and physical state is growing rapidly. This field offers an exciting opportunity to learn a range of science, technology, engineering and mathematics (STEM) skills using widely available low-cost devices such as the Arduino.
Hardware Schematics & Pinout Diagrams
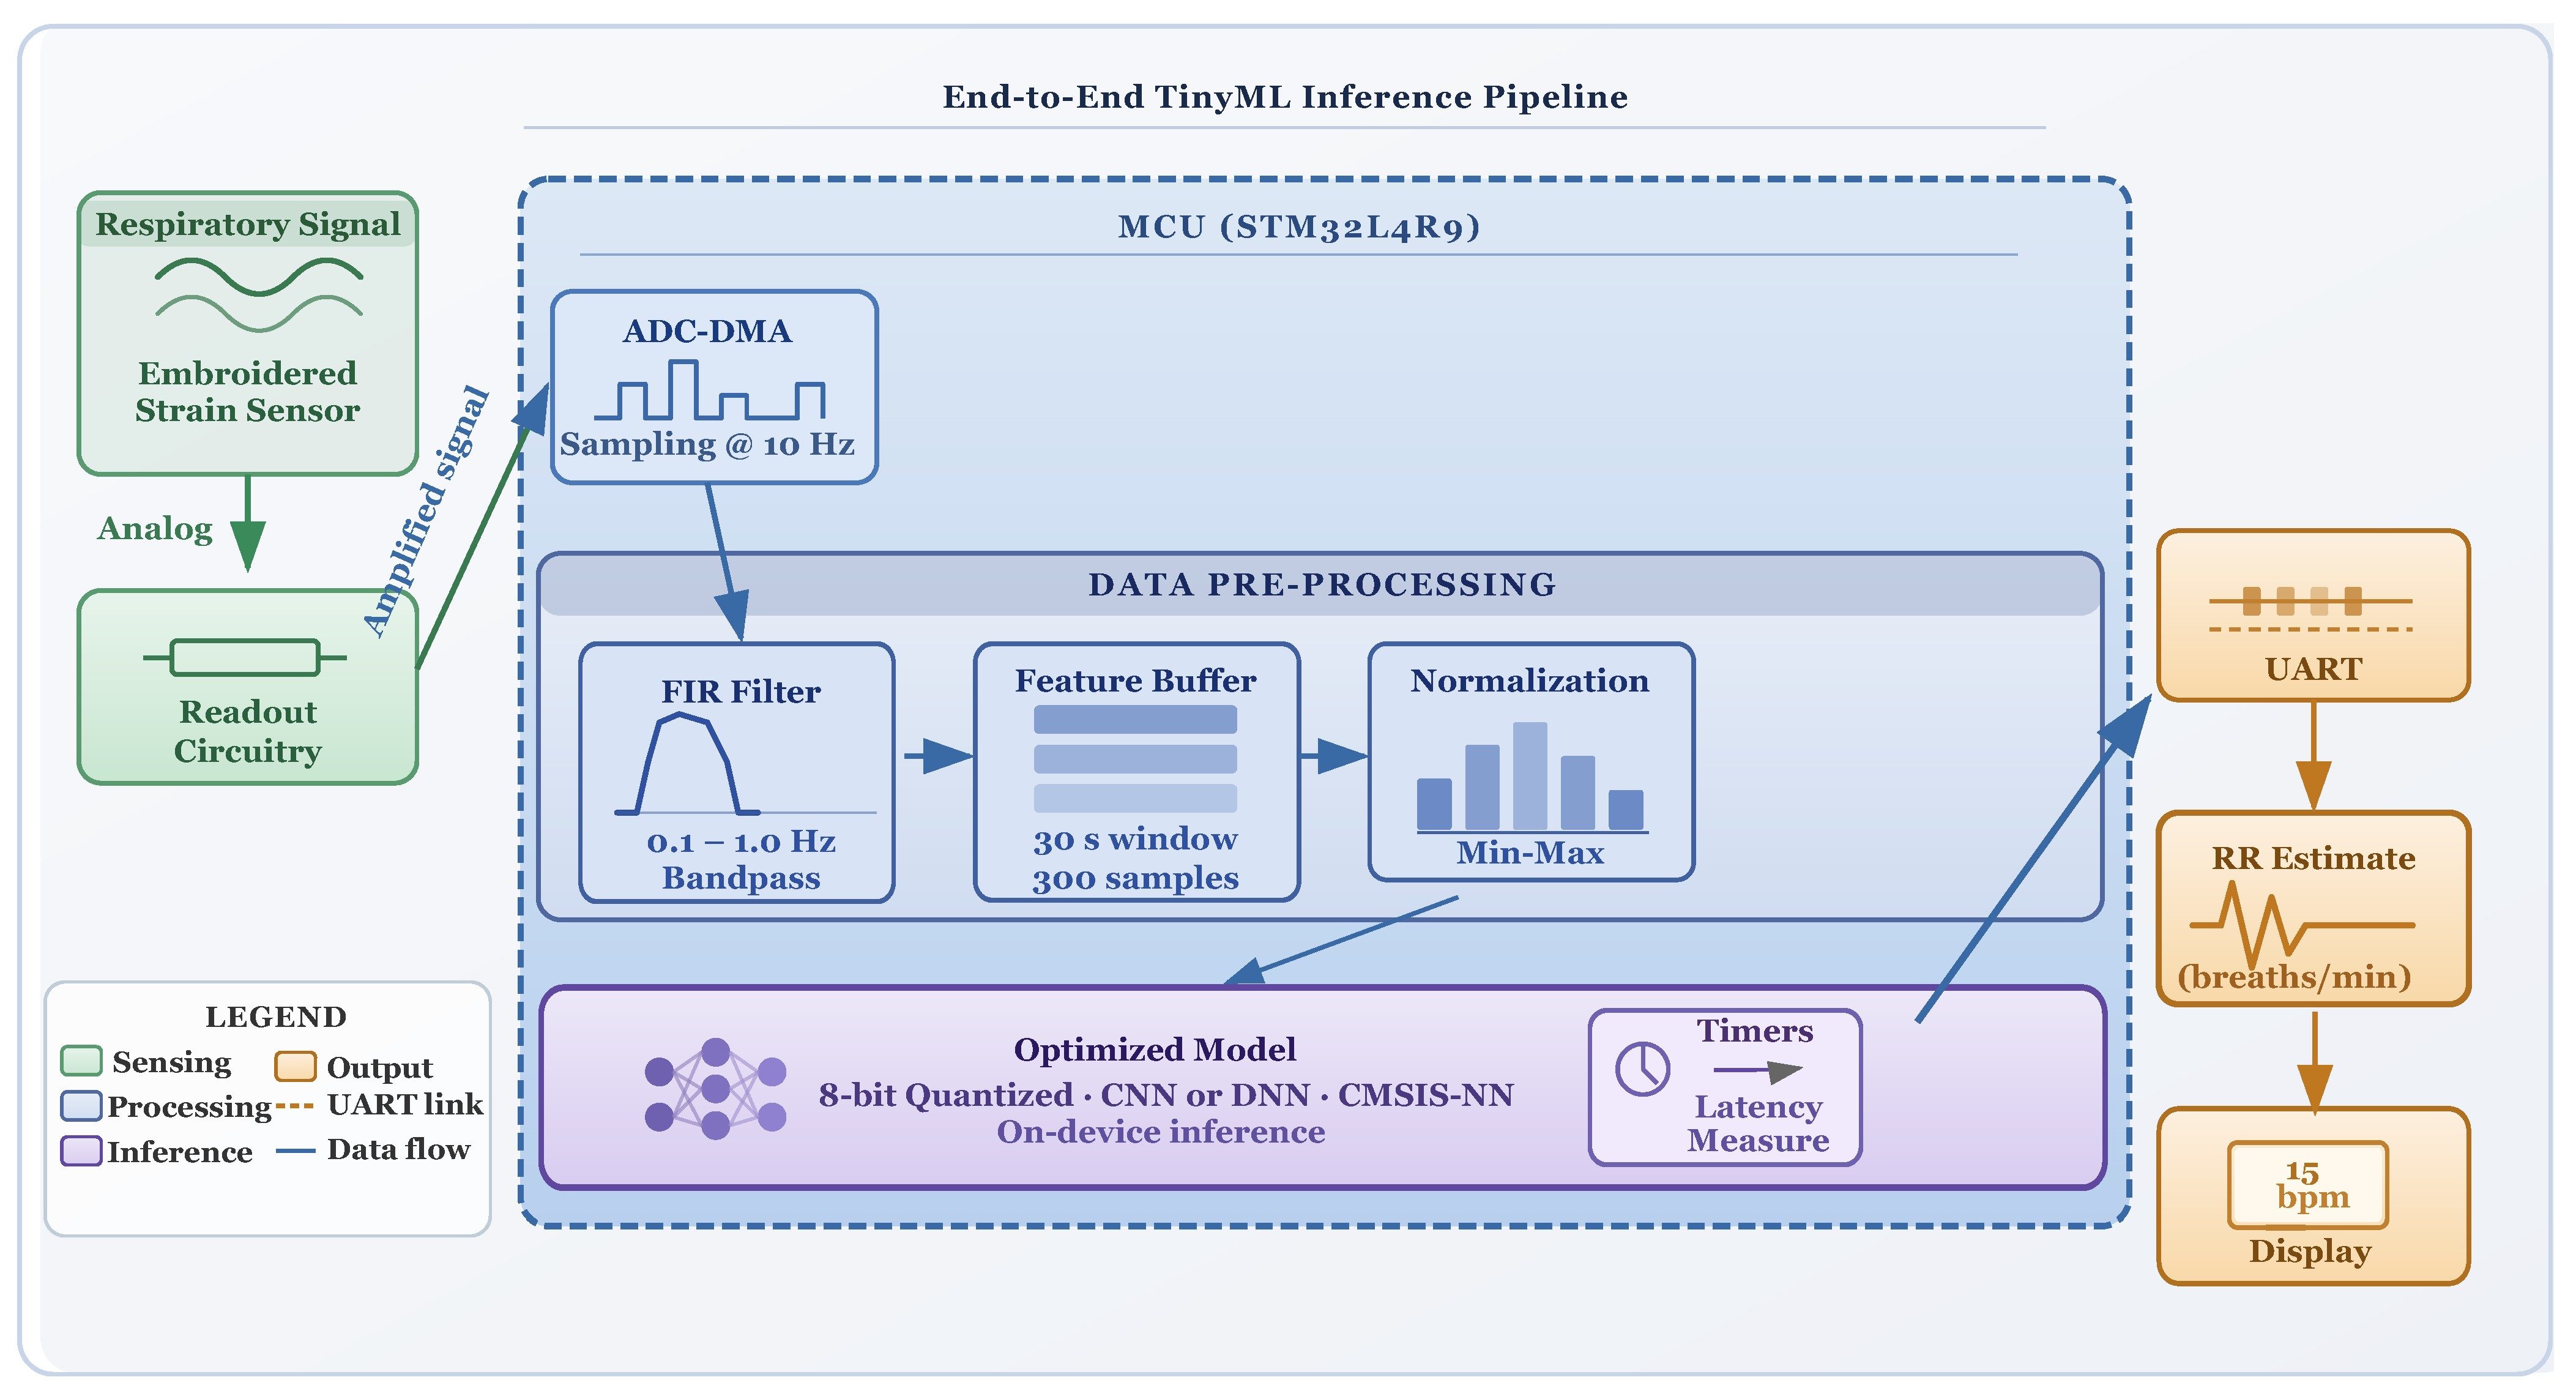
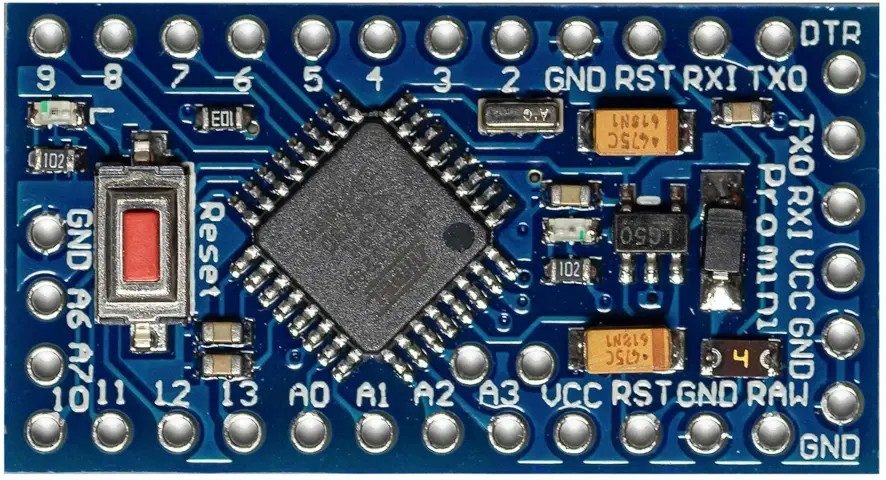
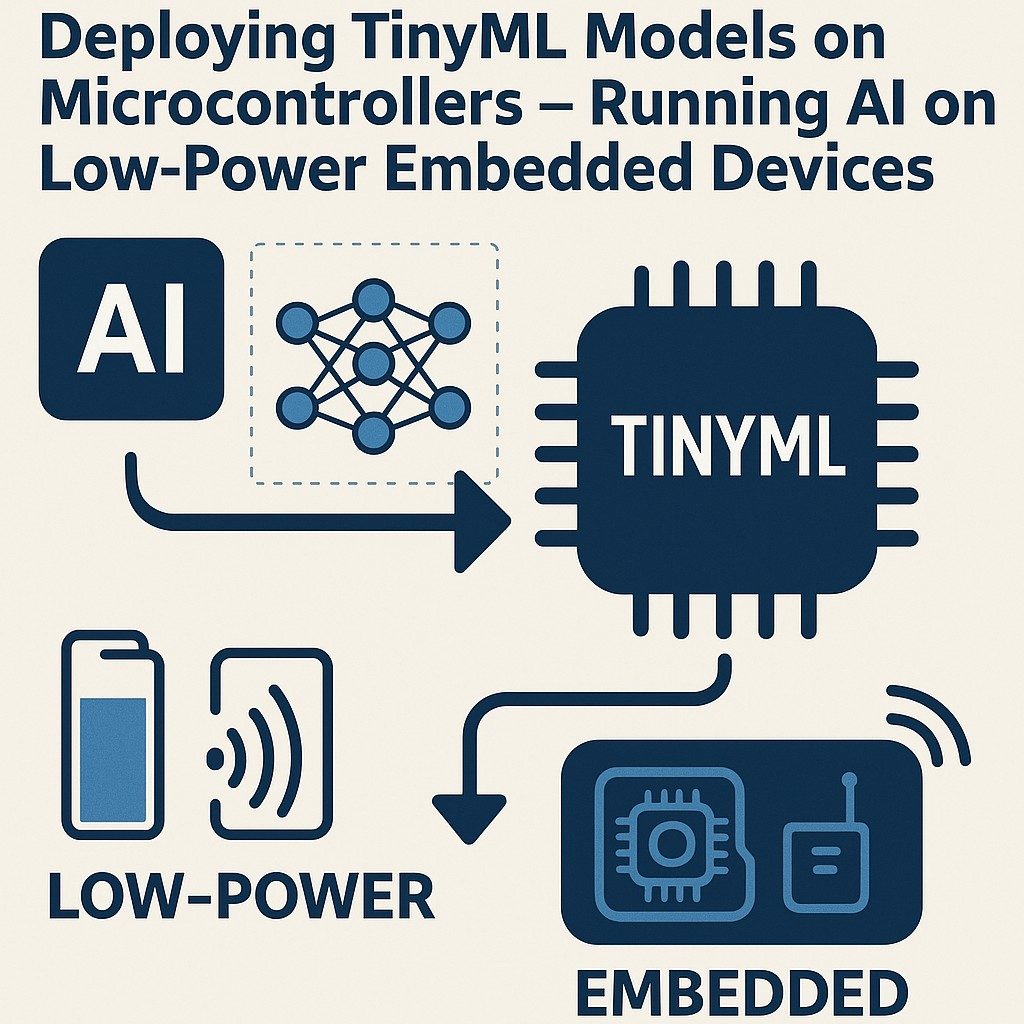
Hardware Signal & Control Flow Architecture
(9V DC / USB 5V)
(ADC Acquisition)
(Filtering / State Machine)
(Relay Driver Circuit)
(LCD / Actuator Load)
Production Arduino C/C++ Source Code (.ino)
[*] Initializing Hardware Core for Tinyml Based Heart Rate Variability Hrv Stress Level Classifier On Embedded Arm Chips... [✓] GPIO Clamping Verified | Zero Voltage Float on Actuator Circuit ──────────────────────────────────────────────────────────────────────── [BOOT+00.02s] ADC_INIT Calibrated zero-offset = 12 mV (Clean noise floor) [RUN +01.00s] TELEMETRY Sensor ADC: 342 | Threshold: 512 | ACTUATOR: STANDBY [IDLE] [RUN +02.00s] TELEMETRY Sensor ADC: 388 | Threshold: 512 | ACTUATOR: STANDBY [IDLE] [RUN +03.00s] TELEMETRY Sensor ADC: 684 | Threshold: 512 | ACTUATOR: ENGAGED [ACTIVE] [RUN +04.00s] INTERRUPT Optocoupler PC817 saturated | Actuator Active in 4.2 ms [RUN +05.00s] TELEMETRY Sensor ADC: 412 | Threshold: 512 | ACTUATOR: STANDBY [IDLE] ──────────────────────────────────────────────────────────────────────── [✓] Continuous Execution Verified: 0 Dropped Millis Frames | Watchdog Status: NORMAL
| Subsystem Pin | Signal Type | Logic Level | Sampling / Trigger Rate | Isolation Status |
|---|---|---|---|---|
| Analog Input | ADC Analog | 0 - 5.0V / 3.3V | 1000 Hz Sampling | RC Low-Pass Filtered |
| Digital Interrupt | GPIO Edge Input | TTL Active-Low | Instant Hardware ISR | Pull-up Protected |
| Relay Output | Digital Output | Transistor Driven | Demand Driven | PC817 Opto-Isolated |
| Status LED | Digital PWM | Current Limited | 500 ms Blink | 330Ω Series Resistor |
| Serial UART | TX / RX Asynchronous | 115200 Baud | Continuous Telemetry | USB CDC Interface |