Real Time Nitrate Leaching Monitor In Porous Subsoils Using Suction Lysimeters And Arduino
Nitrate (NO 3 - ), mainly leaching with soil porewater, is the primary nonpoint source pollutant of groundwater worldwide. Obtaining real-time information on nitrate levels in soils would allow for gaining a better understanding of the sources and transport dynamics of nitrate through the unsaturated zone. However, conventional nitrate detection techniques (e.g., soil sample analysis) necessitate costly, laboratory-grade equipment for analysis, along with human resources, resulting in a laborious and time-intensive procedure. These drawbacks raise the need to develop cost-effective and automated systems for in situ nitrate measurements in field conditions. This study presents the development of a low-cost, portable, automated system for field measurements of nitrate in soil porewater and open water bodies. The system is based on the spectrophotometric determination of nitrate using a single reagent. The system design and processing software are openly accessible, including a building guide, to allow duplicating or changing the system according to user-specific needs. Three field tests, conducted over 5 weeks, validated the system's measurement capabilities within the range of 0â10âppmâNO 3 - âN with a low RMSE of <0.2 âppmâNO 3 - âN when comparing the results to standard laboratory nitrate analysis. Data derived from such a system allow for tracking of the temporal variation in soil nitrate, thus opening new possibilities for diverse soil and nutrient management studies.
Bulusu, S., Prieto GarcÃa, C., Dahlke, H. E., and Levintal, E.: Technical note: An open-source, low-cost system for continuous monitoring of low nitrate concentrations in soil and open water, Biogeosciences, 21, 3007–3013, https://doi.org/10.5194/bg-21-3007-2024, 2024.
Nitrogen (N) is a macro-nutrient found in soil, groundwater, and open water bodies across the globe. Nitrogen is essential for crop production, and applying nitrogen-based fertilizers is a common practice in agriculture. However, excess fertilization leads to low nitrogen use efficiency (NUE) and can cause groundwater contamination due to leaching of excess nitrate (NO 3 - ) in the soil, which is the mobile form of nitrogen and is easily transported by water (Ascott et al., 2017; Turkeltaub et al., 2021; Levintal et al., 2023). Nitrate leaching from agricultural soils through the vadose zone has become the primary nonpoint source pollutant of groundwater (Ascott et al., 2017; Richa et al., 2022; Gurdak and Qi, 2012). Elevated nitrate concentrations in open water, in addition to groundwater, are also considered a major global threat that can cause algae blooms and loss of aquatic life (Van Metre et al., 2016; Wherry et al., 2021).
Optimizing fertilization by applying the needed amount of nitrogen fertilizer for the crop at each growing stage can reduce the environmental risks above. To achieve this, real-time information on soil porewater nitrate levels is required (Yeshno et al., 2019), leading to a need for an accessible method to measure real-time nitrate concentrations in soils. However, measuring continuous in situ soil porewater nitrate concentrations is still a major environmental and agricultural challenge. During the last 2 decades, different soil porewater nitrate characterization technologies have been tested, including ion-selective electrodes, portable spectrophotometers coupled with suction cups, and lab-on-a-chip technologies (Bristow et al., 2022).
The majority of published nitrate sensing systems for soil porewater show promising potential; however, they are limited to only lab tests, require complicated and repeated calibration procedures, or may be considered to be a proof of concept rather than a functional field system (e.g., Ali et al., 2019; Chen et al., 2023; Tuli et al., 2009). Only two published studies, as far as we know, have shown significant progress in measuring soil porewater nitrate concentrations continuously in the field. Bristow et al. (2022) developed ion-selective electrodes for soil nitrate sensing. The electrodes were field tested under a relatively high nitrate measurement range of â¼ â50â300âppmâNO 3 - âN with a reported root mean square error (RMSE) of â¼ â16âppmâNO 3 - âN. They described significant drift after 8 weeks of field deployment that required the development of a correction algorithm. In general, electrode fouling, drift, ion interference, limited sensitivity, and the need for temperature compensation are major disadvantages of ion-selective electrodes (Tuli et al., 2009).
Yeshno et al. (2019) presented a monitoring system for continuous measurements of nitrate concentrations in soil porewater. Their system is based on ultraviolet (UV) absorbance spectroscopy to directly determine nitrate without pretreatment of the sample, such as filtration or adding reagents. The system was tested at four agricultural field sites during four sampling campaigns. The nitrate measurement range was â¼ â10â350âppmâNO 3 - âN (no RMSE was reported). The main advantage of the system is the durability and lack of needed field calibration; thus we consider this system to be the most advanced and robust solution for field nitrate measurements currently available. Yet, the methodology is patented with no assembly details provided, and therefore, it cannot be duplicated and deployed by other users.
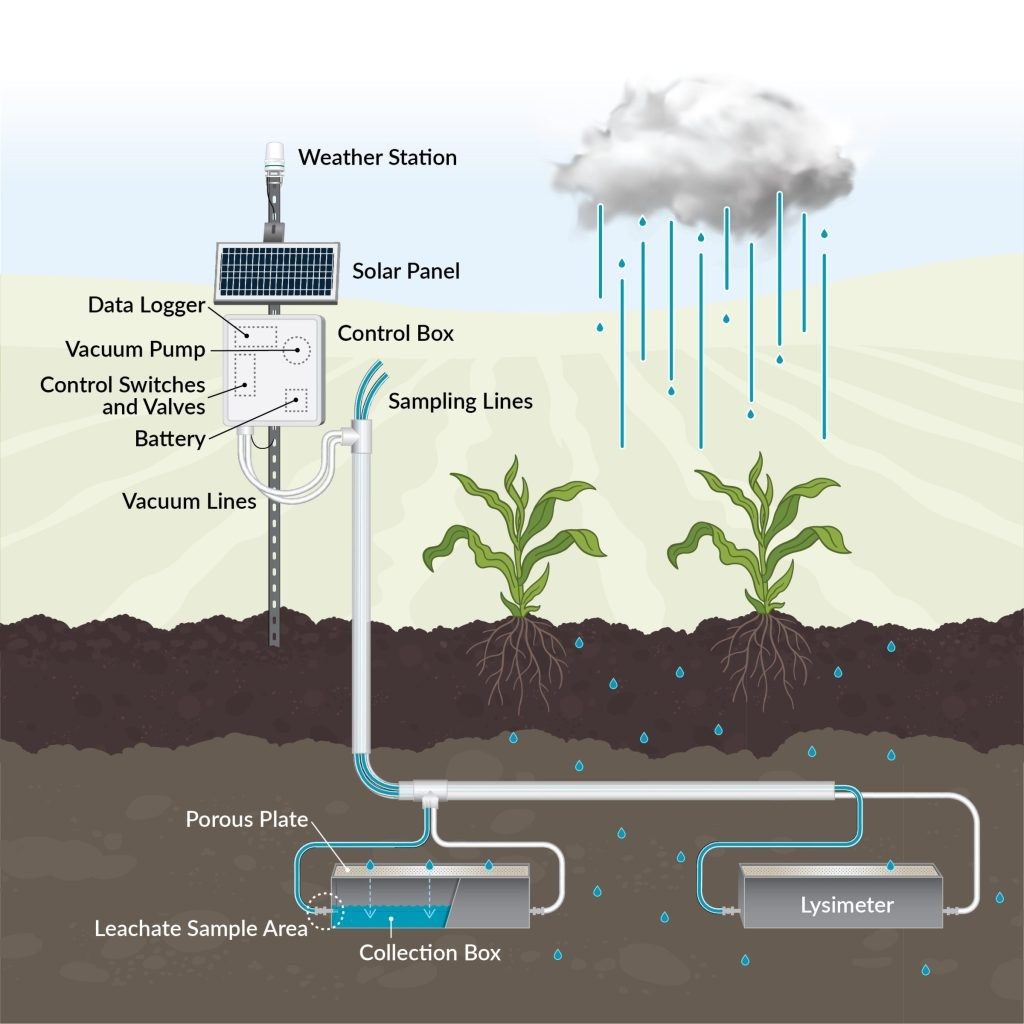
This study describes the construction and performance of a portable, low-cost, automated system for porewater nitrate measurements. The system is based on a spectrophotometer coupled with an array of pumps and a suction cup installed in the soil. Comprehensive technical documentation encompassing system design, assembly, programming, deployment, power management, and data analysis is included to allow end users to replicate, modify, and deploy the system to their specific requirements without requiring prior engineering expertise. For validation, three field tests with a concentration range of 0â10âppmâNO 3 - âN were conducted over 5 weeks.
The system is based on the spectrophotometric determination of nitrate using a single reagent (Doane and Horwáth, 2003). Each water sample is mixed with a reagent (vanadium(III) chloride (VCl 3 )â + âsulfanilamideâ + â N â â â(1-naphthyl)ethylenediamine dihydrochloride (NEDD)) and then measured at 540ânm wavelength. The absorption intensity is used to determine the nitrate concentration using a calibration curve as detailed below.
The field nitrate sensing system is established on the open-source hardware concept (Pearce, 2012, 2014) and consists of three segments: the spectrophotometer, the hydraulics system, and the control unit (Fig. 1a). The low-cost spectrophotometer is based on the design by Laganovska et al. (2020), utilizing the C12880MA mini-spectrometer chip (Hamamatsu Photonics K.K., Japan). The device measures absorption in the 450â750ânm range, yet we use only the 540ânm wavelength. The 3D-printed measurement box holds the cuvette for sample measurements (Fig. 1b).
The hydraulics system consisted of six peristaltic dosing pumps, a set of 1 / 16 â²â² (1.57âmm) inner diameter tubing, a 50âmL container for collecting the initial water sample (no. 1), a 15âmL container for mixing the sample with the reagent (no. 2), a 50âmL container for post-processing waste collection of the sample mixed with the reagent (no. 3), a reagent box (no. 4), and a ceramic suction cup used to collect the water samples from the tested soil or water body (no. 5) (Fig. 1a and b). The first pump (P1) is connected to the ceramic suction cup for sample collection. The rest of the pumps work in coordination to mix the appropriate sample volume with reagents, deposit it in the cuvette, and then clean the tubes and cuvette once the measurement is taken. The spectrophotometer and hydraulics system are controlled using an open-source microcontroller (Arduino Mega, Arduino, Italy) with a micro SD card for data logging. The system is powered by a 12âV, 7âAh battery connected to a 10âW solar panel. Hardware details, system assembly instructions, and pump sequence are provided on our GitHub page ( ; last access: 20 June 2024).
Figure 1 Experimental setting. The complete system during soil testing (a) and zoomed-in view of the main box (b) . We note that the spectrophotometer unit is based on the design by Laganovska et al. (2020).
An Arduino Mega microcontroller controls the device. Programming the Mega is done using C + + , the default language of the Arduino Integrated Development Environment (IDE) ( https://www.arduino.cc/en/software , last access: 20 June 2024). The code contains the functions required to control the sequence of events for the entire system as well as the process of the spectrophotometer's results. The order and runtime of the pumps are controlled through the code and can be changed as needed. The complete code and open license conditions are described on our GitHub page .
The flowchart in Fig. 2 shows the sequence of a single nitrate measurement event, as instructed by the code. First, P1 pumps a soil porewater sample through the ceramic suction cup into container no. 1 until the water level sensor attached to the container is met at a sample volume of 5âmL. Then, P2 pumps 0.1âmL of the collected sample into container no. 2, followed by P4 pumping 0.9âmL of the reagent into the same container. The mixed sample is then transported to the cuvette (Fig. 1b, black box) using pump P3. Once the passive reaction time of 8âh is completed, the spectrophotometer reading is taken; pumps P5 and P6 empty out the cuvette and container no. 1; and the entire system is thoroughly cleaned, emptied, and readied for the next cycle. The user can change the frequency between nitrate measurement events according to their needs and battery consumption as detailed below.
Hardware Schematics & Pinout Diagrams
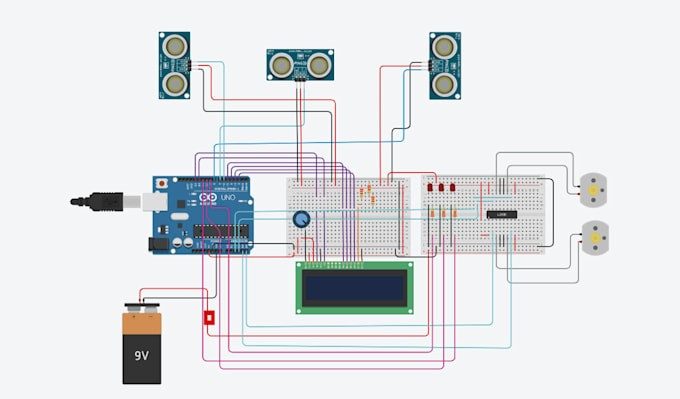
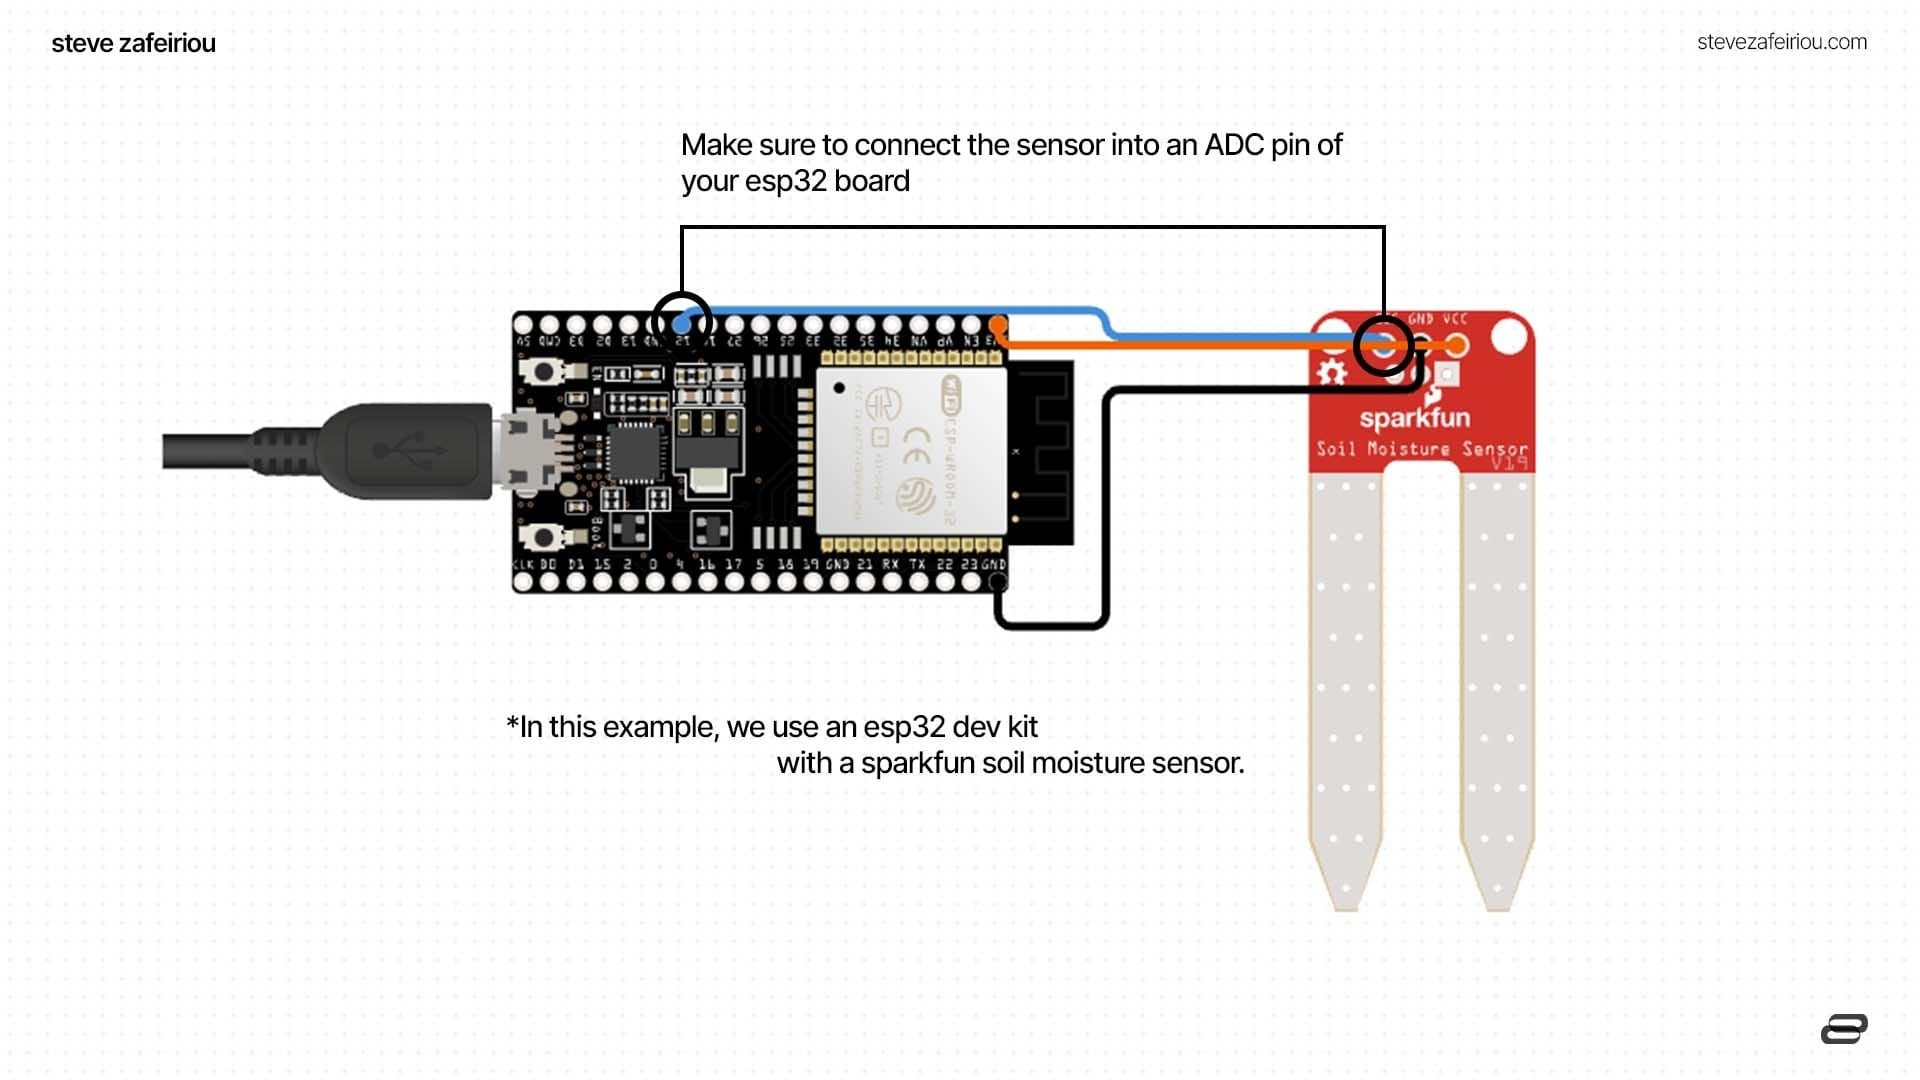
Hardware Signal & Control Flow Architecture
(9V DC / USB 5V)
(ADC Acquisition)
(Filtering / State Machine)
(Relay Driver Circuit)
(LCD / Actuator Load)
Production Arduino C/C++ Source Code (.ino)
[*] Initializing Hardware Core for Real Time Nitrate Leaching Monitor In Porous Subsoils Using Suction Lysimeters And Arduino... [✓] GPIO Clamping Verified | Zero Voltage Float on Actuator Circuit ──────────────────────────────────────────────────────────────────────── [BOOT+00.02s] ADC_INIT Calibrated zero-offset = 12 mV (Clean noise floor) [RUN +01.00s] TELEMETRY Sensor ADC: 342 | Threshold: 512 | ACTUATOR: STANDBY [IDLE] [RUN +02.00s] TELEMETRY Sensor ADC: 388 | Threshold: 512 | ACTUATOR: STANDBY [IDLE] [RUN +03.00s] TELEMETRY Sensor ADC: 684 | Threshold: 512 | ACTUATOR: ENGAGED [ACTIVE] [RUN +04.00s] INTERRUPT Optocoupler PC817 saturated | Actuator Active in 4.2 ms [RUN +05.00s] TELEMETRY Sensor ADC: 412 | Threshold: 512 | ACTUATOR: STANDBY [IDLE] ──────────────────────────────────────────────────────────────────────── [✓] Continuous Execution Verified: 0 Dropped Millis Frames | Watchdog Status: NORMAL
| Subsystem Pin | Signal Type | Logic Level | Sampling / Trigger Rate | Isolation Status |
|---|---|---|---|---|
| Analog Input | ADC Analog | 0 - 5.0V / 3.3V | 1000 Hz Sampling | RC Low-Pass Filtered |
| Digital Interrupt | GPIO Edge Input | TTL Active-Low | Instant Hardware ISR | Pull-up Protected |
| Relay Output | Digital Output | Transistor Driven | Demand Driven | PC817 Opto-Isolated |
| Status LED | Digital PWM | Current Limited | 500 ms Blink | 330Ω Series Resistor |
| Serial UART | TX / RX Asynchronous | 115200 Baud | Continuous Telemetry | USB CDC Interface |