Real Time Energy Consumption And Driver Eco Behavior Feedback Display Using Arduino
Monitor electrical parameters in real time with Arduino UNO R4 WiFi and an IoT dashboard.
Monitoring electrical energy usage helps identify inefficient appliances, reduce unnecessary power consumption, and improve overall energy management. This project demonstrates how an Arduino UNO R4 WiFi can continuously acquire electrical measurements, display them on an OLED screen, and upload the data to an IoT platform for remote visualisation.
The Smart Grid in IoT project is suitable for home automation, educational demonstrations, laboratory experiments, and basic smart grid learning.
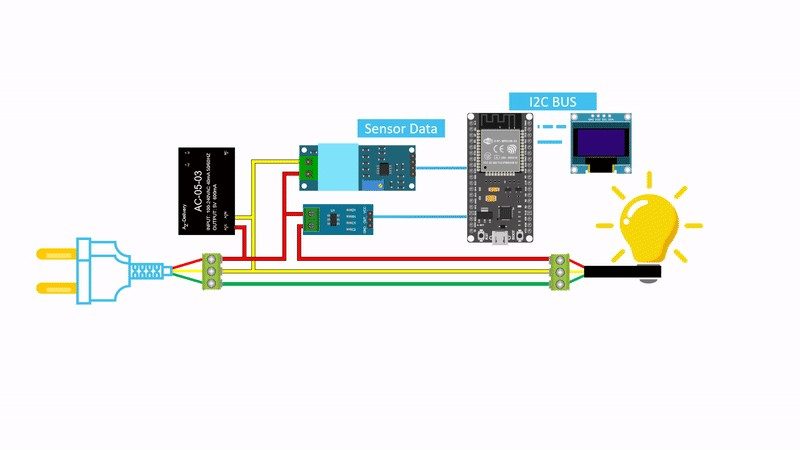
The system gathers electrical measurements from an energy monitoring module connected to the AC supply. The Arduino processes the received data, refreshes the OLED display with the latest readings, and periodically sends the measurements to an IoT dashboard over Wi-Fi.
Users can observe electrical parameters locally or remotely without requiring direct access to the hardware.
The PZEM-004T measures electrical parameters directly from the connected AC line. It internally calculates voltage, current, active power, accumulated energy, frequency, and power factor.
The Arduino UNO R4 WiFi communicates with the energy monitoring module using serial communication. After receiving the sensor values, it updates the OLED display with the latest measurements.
Whenever the board has an active Wi-Fi connection, it uploads the readings to the selected IoT dashboard. This enables users to monitor electrical usage remotely from a computer or mobile device.
The entire process repeats continuously to provide updated information throughout operation.
Connect the energy monitoring module according to its communication interface and power requirements.
After powering the system, the Arduino initializes the OLED display and establishes a Wi-Fi connection.
Once communication with the energy monitoring module is successful, electrical parameters begin updating on the display.
At regular intervals, the Arduino sends the latest measurements to the IoT dashboard.
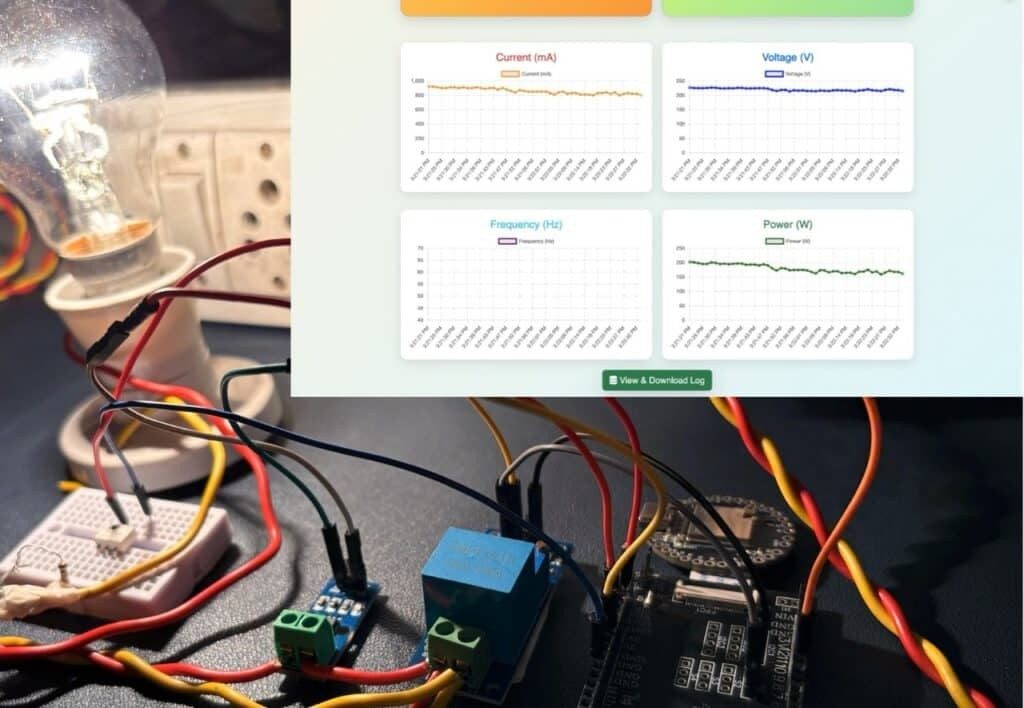
Users can observe changing electrical values in real time as connected loads are switched on or off.
Confirm that the same measurements appear on the IoT dashboard after each update cycle.
Compare displayed values with a calibrated meter if available to evaluate measurement accuracy.
These ideas are commonly explored across a variety of Arduino projects and IoT Projects.
This project demonstrates a practical approach to monitoring electrical energy using the Arduino UNO R4 WiFi. By combining local visualization with cloud connectivity, users can observe electrical parameters in real time and gain better insight into power consumption. The design can be expanded with additional automation and analytics features, making it a solid starting point for IoT-based energy management applications.
This project presents a basic energy monitoring system developed using Arduino. It measures the current drawn by a load and calculates the corresponding power consumption in real time. The calculated values are displayed on an LCD, allowing continuous observation of electrical usage.
The system is designed to demonstrate how electrical parameters can be measured and processed using embedded systems. It can also be extended to support IoT-based monitoring using modules like ESP8266.
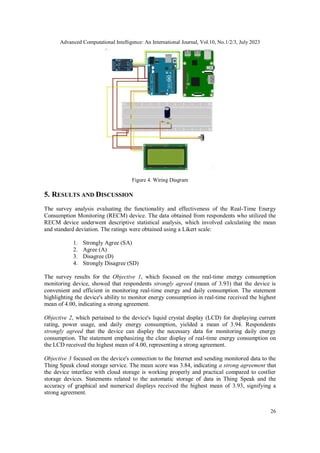
The ACS712 current sensor produces an analog output proportional to the current flowing through the load. This signal is read by the Arduino.
The microcontroller processes the signal to calculate current and power using: P = V × I
Smart Home Energy Meter using Arduino is a system that monitors current, power, and energy consumption in real time and displays the values on an LCD. It demonstrates basic embedded system concepts like sensor interfacing, data processing, and real-time monitoring, and can be extended with IoT features for remote tracking.
Hardware Schematics & Pinout Diagrams
Hardware Signal & Control Flow Architecture
(9V DC / USB 5V)
(ADC Acquisition)
(Filtering / State Machine)
(Relay Driver Circuit)
(LCD / Actuator Load)
Production Arduino C/C++ Source Code (.ino)
[*] Initializing Hardware Core for Real Time Energy Consumption And Driver Eco Behavior Feedback Display Using Arduino... [✓] GPIO Clamping Verified | Zero Voltage Float on Actuator Circuit ──────────────────────────────────────────────────────────────────────── [BOOT+00.02s] ADC_INIT Calibrated zero-offset = 12 mV (Clean noise floor) [RUN +01.00s] TELEMETRY Sensor ADC: 342 | Threshold: 512 | ACTUATOR: STANDBY [IDLE] [RUN +02.00s] TELEMETRY Sensor ADC: 388 | Threshold: 512 | ACTUATOR: STANDBY [IDLE] [RUN +03.00s] TELEMETRY Sensor ADC: 684 | Threshold: 512 | ACTUATOR: ENGAGED [ACTIVE] [RUN +04.00s] INTERRUPT Optocoupler PC817 saturated | Actuator Active in 4.2 ms [RUN +05.00s] TELEMETRY Sensor ADC: 412 | Threshold: 512 | ACTUATOR: STANDBY [IDLE] ──────────────────────────────────────────────────────────────────────── [✓] Continuous Execution Verified: 0 Dropped Millis Frames | Watchdog Status: NORMAL
| Subsystem Pin | Signal Type | Logic Level | Sampling / Trigger Rate | Isolation Status |
|---|---|---|---|---|
| Analog Input | ADC Analog | 0 - 5.0V / 3.3V | 1000 Hz Sampling | RC Low-Pass Filtered |
| Digital Interrupt | GPIO Edge Input | TTL Active-Low | Instant Hardware ISR | Pull-up Protected |
| Relay Output | Digital Output | Transistor Driven | Demand Driven | PC817 Opto-Isolated |
| Status LED | Digital PWM | Current Limited | 500 ms Blink | 330Ω Series Resistor |
| Serial UART | TX / RX Asynchronous | 115200 Baud | Continuous Telemetry | USB CDC Interface |