Real Time Detection Of Nocturnal Hypoglycemia In Diabetic Patients Using Arduino And Galvanic Skin Response
This page explains how to interface a GSR sensor with Arduino, including the necessary code and a block circuit schematic.
EDA (Electro Dermal Activity) refers to the electric characteristics of human skin. According to EDA principles, skin resistance changes based on the activity of sweat glands within the skin. Our nervous system controls sweating, and skin conductance serves as an indicator of physiological arousal.
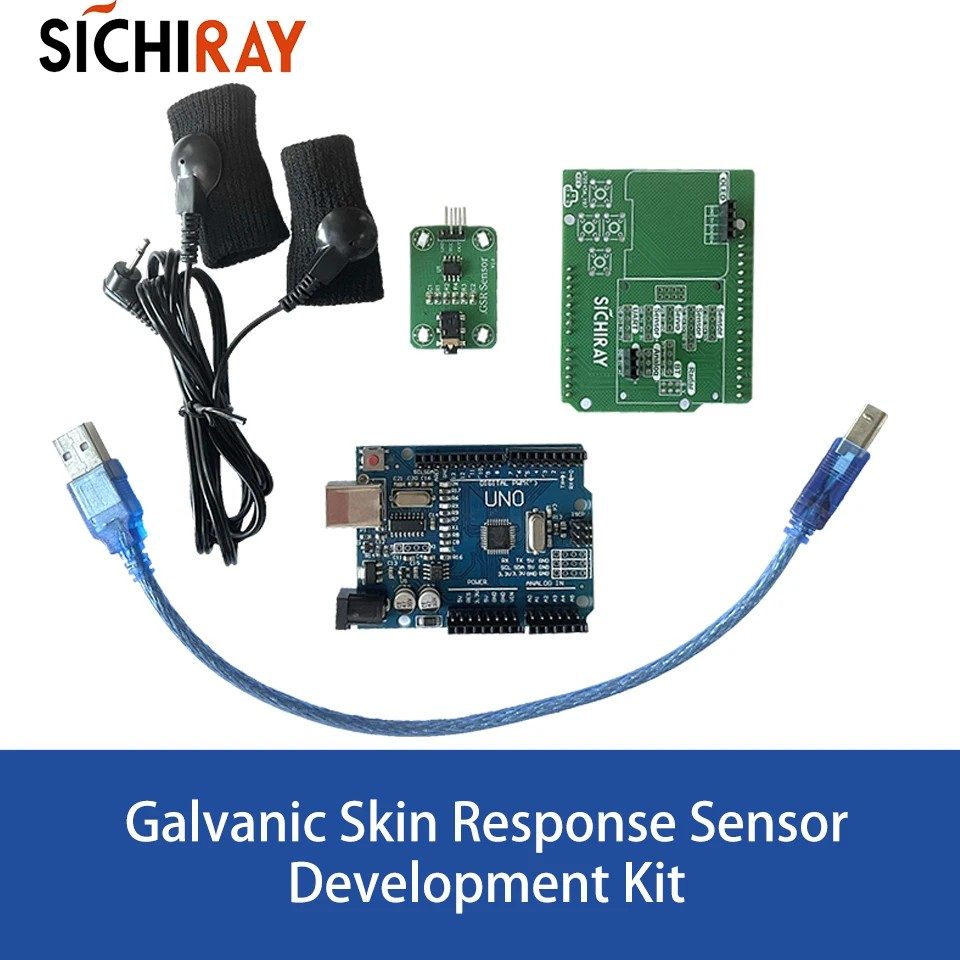
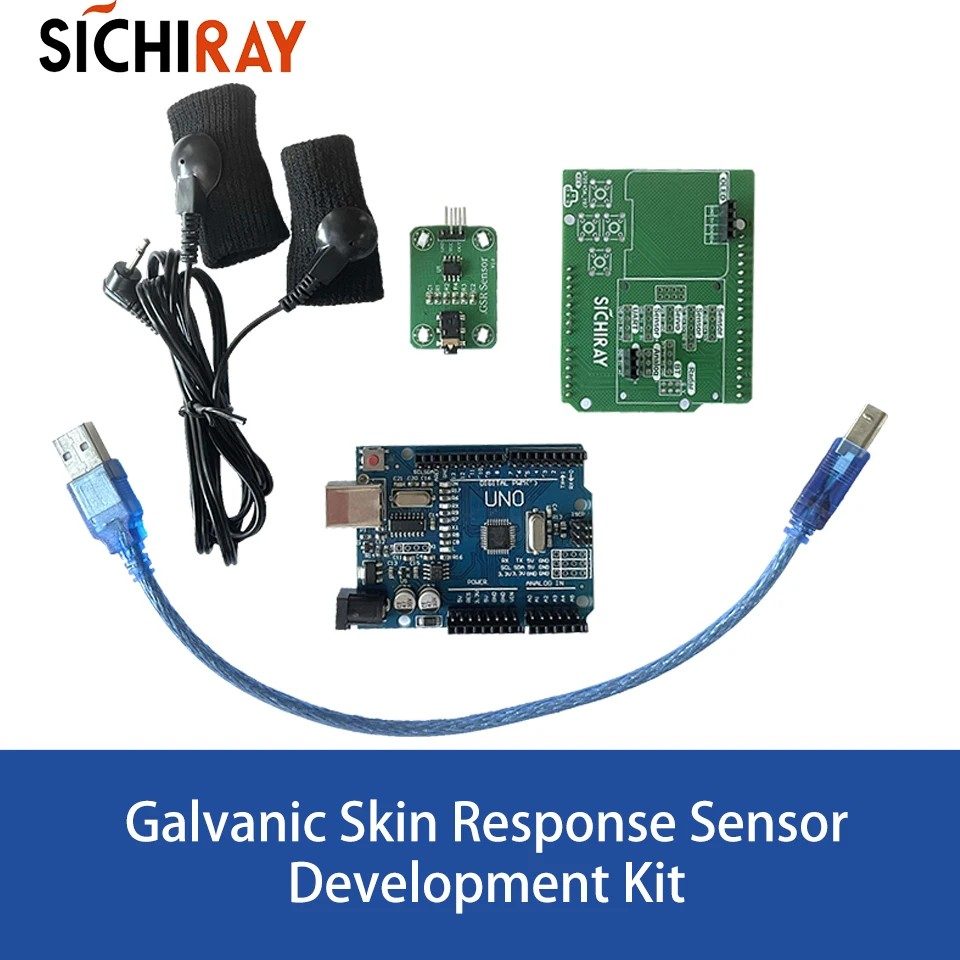
GSR stands for Galvanic Skin Response. A GSR sensor measures the electrical conductance of the skin. It typically consists of two electrodes placed on two fingers of one hand.
GSR sensors are used to monitor sleep quality and measure emotional arousal. Essentially, a GSR sensor functions as a kind of ohmmeter, measuring the electric conductance between two points.
Sweat glands in our bodies are controlled by the nervous system. Due to varying emotional states, such as stress or relaxation, the amount of sweat produced by these glands changes. Skin conductivity changes with sweat secretion. These conductivity changes can be measured by monitoring voltage variations.
When skin resistance is high, conductive voltage is low, and vice versa. For optimal results, electrodes are often placed on the index and middle fingers due to thinner skin and less hair in those areas. GSR sensors from Seeed Technology Co., Ltd., include Grove GSR v1.0 and Grove GSR v1.2. The part number SKU: 078-101020052 represents a GSR sensor from Seeed Studio. In India, these sensors are distributed by Evelta Electronics, Mumbai.
The GSR sensor needs 5V for operation. Data acquisition occurs within a range of 1 to 10 Hz. The GSR signal is based on conductance, which is the inverse of skin resistance.
The following table outlines the connections between the GSR sensor and an Arduino board.
The following Arduino code demonstrates how to interface a GSR sensor with an Arduino UNO or Arduino Mega board. After compiling and running this code, it reads the sensor value from the GSR sensor connected to analog pin A0 of the Arduino board.
The code reads analog data (in the range of 0 to 1023) and converts it into an analog voltage within the range of 0 to 5V. The converted voltage is then displayed on the serial monitor. The initial serial communication speed is set to 9600 bps.
Learn how to interface a blood pressure sensor with Arduino using provided code and a circuit schematic. Monitor systolic, diastolic pressure, and pulse rate.
Learn how to interface a TCS3200 color sensor with Arduino. This guide provides a diagram, working principles, and Arduino code for detecting RGB color values.
Learn how to connect a GPS sensor to an Arduino, understand the basics of GPS technology, and use example code to read and display GPS data.
Learn how to interface an ESP32 or Arduino with a gas sensor (MQ-02). Includes diagrams, working principle, and example Arduino code for gas detection and data uploading.
Learn how to interface an Arduino board with a gyro sensor for rotational motion detection. Includes wiring diagram, working principle, and example Arduino code.
Interface an Arduino with a heartbeat sensor. Includes wiring diagram, example code, and explanation of the working principle.
[last updated: 2025-08-22] Disclaimers bioAmp EXG pill -----------------------------------------
Diabetes mellitus is an acute metabolic disease that can cause damage to the body system and lead to complications if not properly managed. The disease has been classified as one of the world’s killer diseases by the World Health Organization (WHO). Implementing a non-invasive near-infrared monitoring device will make diagnosing and monitoring the diseases highly convenient without causing damage to any body tissue or inflicting pain. This paper presents the development of an optically-based glucose sensor using near-infrared spectroscopy to develop a non-invasive blood glucose monitor. The developed near-infrared spectroscopy device was implemented using an Arduino microcontroller, a 940nm LED, a photodiode, a noise filter, an amplifier circuit, and an LED display screen. An invitro experiment of output voltage against infused glucose solution in water placed within the sensor and photodiode is measured for calibration of the device. Twelve people were randomly selected, and the fasting blood glucose level was monitored by measuring it twice (the second measurement was taken after two hours of the first measurement) to get the mean fasting glucose level. The linear regression model was applied, and a correlation coefficient (R2) of 0.9369 was obtained. The high regression coefficient indicates a high correlation between the device's measurements and actual blood glucose levels. This implies that the device's readings are highly predictive of the true glucose concentration.
This work is licensed under a Creative Commons Attribution-NonCommercial 4.0 International License .
Recently, I have looked into how to measure electrodermal activity (EDA) using an Arduino board. A traditional theory of EDA states, that it varies with the skin changes of sweat glands, thus altering the electrical resistance. EDA is modulated as outcome of cognitive processes, emotions, and general human behavior. The traditional mechanic to measure EDA is straigt-forward: By inducing voltages through one electrode, an electrical output is measured using a second electrode. The higher the measured value is, the higher the EDA is.
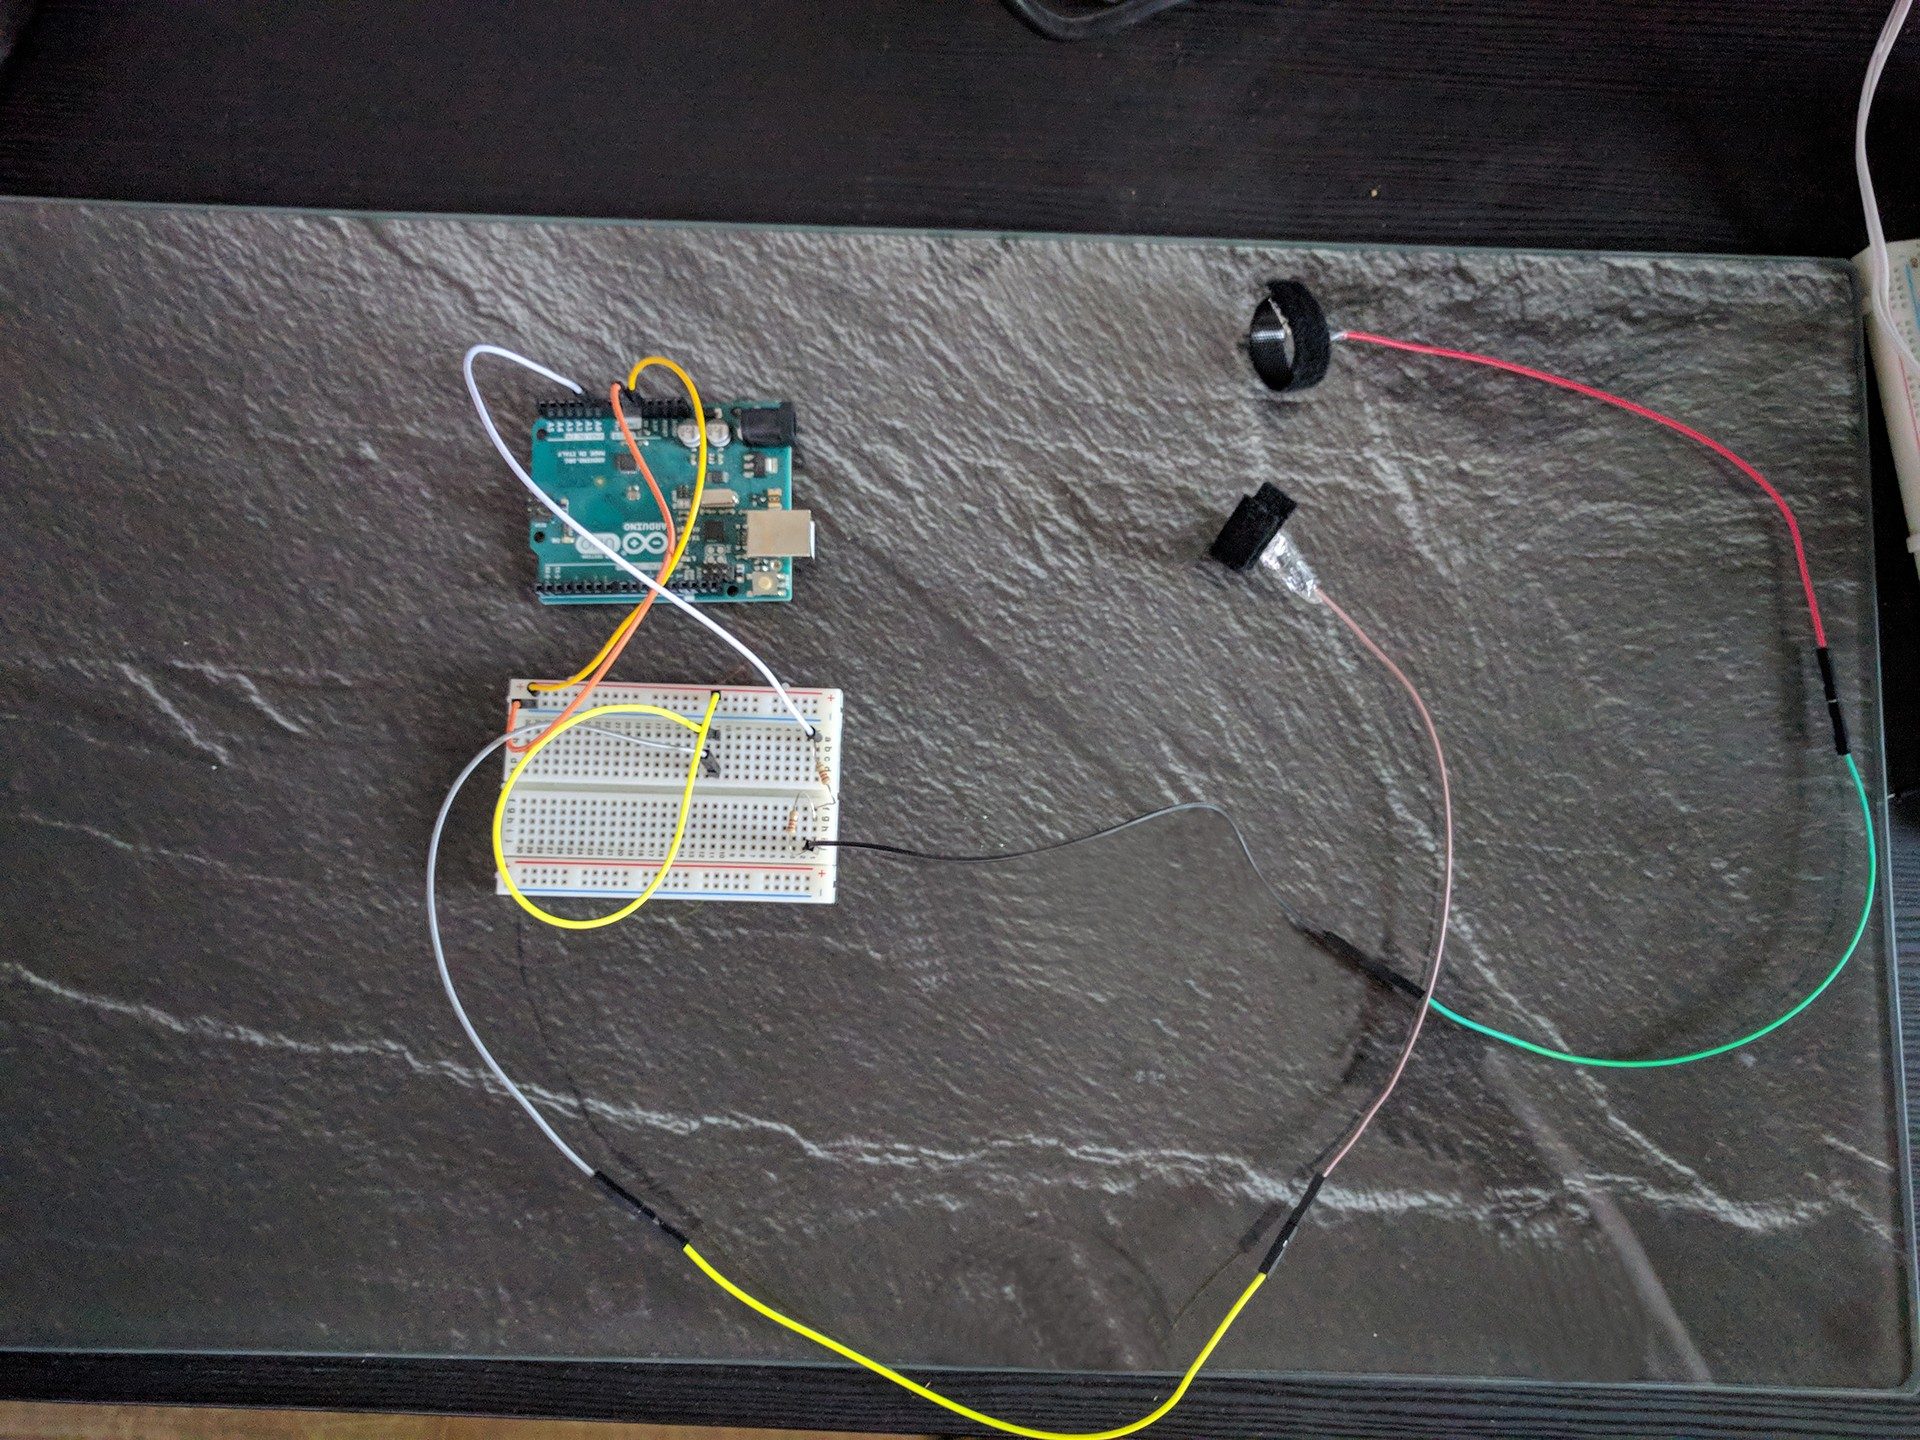
This can be easily achieved using an Arduino. By using the 5V power to induce voltages, a second electrode is used to read the remaining voltages. For this project, you will need:
Connect one cable from the 5V output of the Arduino to a sensor. To construct a sensor, connect a jumper cable to a piece of wrapped aluminium foil. Wrap it around the Velcro tape, which will serve as a retainer for the fingers. Construct a second sensor, which is connected to the breadboard through two 220 resistors. Finally, connect a jumper cable to A0 on the Arduino board. While one sensor induces electrical voltages, the other one measures the remaining arriving electrical potential.
You will need some Arduino code (download here , “Save link as…”) to read the analog value received at port A0. The serial monitor should display the values sent over the serial port. I found some processing code on the web (thanks to Che-Wei Wang, http://cwwang.com/2008/04/13/gsr-reader ) to visualize the outcomes (download a slightly modified version here , right-click and choose “Save link as…”). Put one sensor on your forefinger and one sensor on your ring finger: Upload the Arduino software and run the processing software. You should get a graph visualizing you current EDA. You can modify the sensitivity of measured changes regarding the EDA by removing or changing the inserted resistors. Try to understand how different resistances modify the measured values.
Recently, measuring brain activity (known as electroencephalography, short EEG) to enhance or analyze the experience of user interfaces has attracted great attention. Besides of […]
The Stuttgart hciLab and the Munich HCI groups (LMU) met this week at the Solsteinhaus for an interdisciplinary doctoral colloquium. This included the presentation […]
The IoT (Internet of Things) conference was held in Linz (Austria) this year. Mario Aehnelt (Fraunhofer IGD Rostock, Germany), Sebastian Büttner (Institute […]
On October 13 2016, the German Federal Ministry for Economic Affairs and Energy organized presentations and exhibitions from a project group called “AUTONOMIK 4.0” […]
Hardware Schematics & Pinout Diagrams
Hardware Signal & Control Flow Architecture
(9V DC / USB 5V)
(ADC Acquisition)
(Filtering / State Machine)
(Relay Driver Circuit)
(LCD / Actuator Load)
Production Arduino C/C++ Source Code (.ino)
[*] Initializing Hardware Core for Real Time Detection Of Nocturnal Hypoglycemia In Diabetic Patients Using Arduino And Galvanic Skin Response... [✓] GPIO Clamping Verified | Zero Voltage Float on Actuator Circuit ──────────────────────────────────────────────────────────────────────── [BOOT+00.02s] ADC_INIT Calibrated zero-offset = 12 mV (Clean noise floor) [RUN +01.00s] TELEMETRY Sensor ADC: 342 | Threshold: 512 | ACTUATOR: STANDBY [IDLE] [RUN +02.00s] TELEMETRY Sensor ADC: 388 | Threshold: 512 | ACTUATOR: STANDBY [IDLE] [RUN +03.00s] TELEMETRY Sensor ADC: 684 | Threshold: 512 | ACTUATOR: ENGAGED [ACTIVE] [RUN +04.00s] INTERRUPT Optocoupler PC817 saturated | Actuator Active in 4.2 ms [RUN +05.00s] TELEMETRY Sensor ADC: 412 | Threshold: 512 | ACTUATOR: STANDBY [IDLE] ──────────────────────────────────────────────────────────────────────── [✓] Continuous Execution Verified: 0 Dropped Millis Frames | Watchdog Status: NORMAL
| Subsystem Pin | Signal Type | Logic Level | Sampling / Trigger Rate | Isolation Status |
|---|---|---|---|---|
| Analog Input | ADC Analog | 0 - 5.0V / 3.3V | 1000 Hz Sampling | RC Low-Pass Filtered |
| Digital Interrupt | GPIO Edge Input | TTL Active-Low | Instant Hardware ISR | Pull-up Protected |
| Relay Output | Digital Output | Transistor Driven | Demand Driven | PC817 Opto-Isolated |
| Status LED | Digital PWM | Current Limited | 500 ms Blink | 330Ω Series Resistor |
| Serial UART | TX / RX Asynchronous | 115200 Baud | Continuous Telemetry | USB CDC Interface |