Piezoelectric Footstep Power Generation Tile System With Real Time Energy Storage Telemetry
Piezoelectric energy harvesting system that converts mechanical pressure from human footsteps into electrical energy, monitored in real-time using Arduino Uno with LCD display.
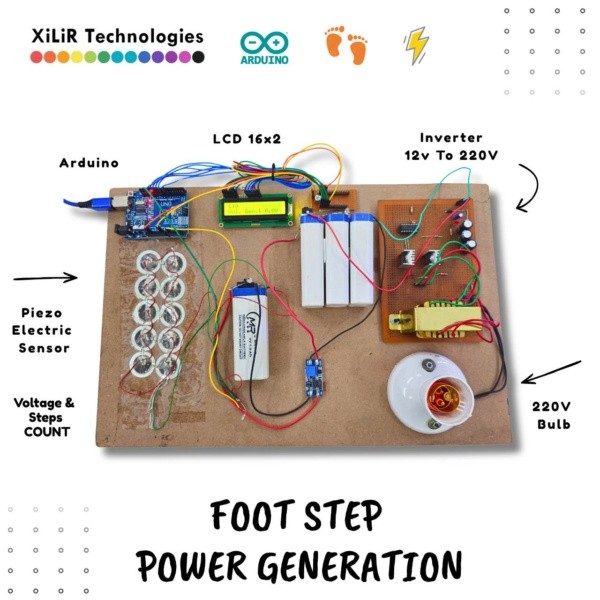
Footstep Power Generation is an embedded systems project that demonstrates renewable energy harvesting from human walking motion. When a person steps on a piezoelectric tile, the mechanical pressure is converted into small bursts of AC voltage. This voltage is rectified, smoothed, and fed into an Arduino Uno, which reads and displays the generated power in real time on a 16x2 LCD screen.
This project highlights how wasted kinetic energy from daily human movement can be captured and utilized for low-power applications — making it a practical and eco-friendly solution for public spaces like railway stations, shopping malls, and walkways.
Piezoelectric Effect — When mechanical pressure is applied to the piezo disc, it deforms and generates a small alternating voltage (typically 2V–10V per step).
Steps and voltage Reading — Arduino reads the steps and voltage from pin A0 (0–1023 values mapped to 0–5V).
The full project report including abstract, literature review, methodology, and references is available in: 📄 docs/project_report.pdf
Institution: East West Institute of Technology Department: [ECE] Academic Year: 2024–2025
Piezoelectric footstep energy harvesting system that converts mechanical pressure into electrical energy, monitored in real-time using Arduino Uno with LCD voltage display.
Arduino-based footstep power generation system using piezo sensors and LCD display.
This project demonstrates a smart and sustainable method of energy harvesting by converting mechanical pressure from footsteps into electrical energy using piezoelectric sensors. The voltage generated is displayed on an LCD screen in real-time.
int sensoroutput = A3; int ledoutput = 13; int THRESHOLD = 20; int sensorValue = 0;
unsigned long lastChangeTime = 0; bool showingStatus = false; unsigned long displayDuration = 2000; // Default duration for LOW
enum PressureState { NONE, PRESSURE_HIGH, PRESSURE_LOW }; PressureState currentState = NONE; PressureState previousState = NONE;
// Welcome and team info lcd.setCursor(0, 0); lcd.print("TEAM 18"); lcd.setCursor(0, 1); lcd.print("Power Gen System"); delay(2000);
lcd.clear; lcd.setCursor(0, 0); lcd.print("KaviyaShree K"); lcd.setCursor(0, 1); lcd.print("HariniShree S"); delay(2000);
lcd.clear; lcd.setCursor(0, 0); lcd.print("Guided by:"); lcd.setCursor(0, 1); lcd.print("Mr.Senthilnathan"); delay(3000);
void loop { sensorValue = analogRead(sensoroutput); Serial.println(sensorValue);
// Determine the current pressure state if (sensorValue >= THRESHOLD) { currentState = PRESSURE_HIGH; } else { currentState = PRESSURE_LOW; }
// Check for state change if (currentState != previousState) { lcd.clear; if (currentState == PRESSURE_HIGH) { digitalWrite(ledoutput, HIGH); lcd.setCursor(1, 0); lcd.print("HIGH"); lcd.setCursor(0, 1); lcd.print("ABOVE THRESHOLD"); displayDuration = 5000; // 5 seconds for HIGH } else { digitalWrite(ledoutput, LOW); lcd.setCursor(1, 0); lcd.print("LOW"); lcd.setCursor(0, 1); lcd.print("BELOW THRESHOLD"); displayDuration = 2000; // 2 seconds for LOW }
// After the specified duration, return to monitoring state if (showingStatus && millis - lastChangeTime >= displayDuration) { lcd.clear; lcd.setCursor(0, 0); lcd.print("Monitoring..."); digitalWrite(ledoutput, LOW); // Ensure LED is off during monitoring showingStatus = false; }
arduino iot piezoelectric lcd embedded-systems voltage-display student-project power-generation energy-harvesting
Convert footsteps into electricity! In this project, we build a working model that generates electric power using Piezoelectric Sensors, displays the voltage on an LCD 16×2 with I2C, and stores energy in a Li-ion 18650 battery using a TP4056 charging module. Ideal for engineering students, science exhibitions, and DIY electronics lovers.
Use thick wires for rectifier and piezo connections due to high-frequency spikes.
Switch (optional): You may add a switch between TP4056 OUT+ and Arduino VIN for manual power control.
Ensure Capacitor Polarity is Correct: 100µF electrolytic capacitor must have + to rectifier positive and – to rectifier ground.
This project showcases a renewable energy system that harnesses mechanical pressure from footsteps into usable electric power. With a voltage display and battery charging mechanism, it’s both functional and educational. Tip: You can expand this project by connecting a boost converter and inverter to power a small AC bulb or USB devices.
In today’s project design, we made a footstep to electricity project that focused on how to generate electricity using foot-steps with a backup charging station (Piezoelectric generator) project. We can use this to charge devices such as smartphones, tablets, and any 5V-rated rechargeable appliance. This foot-step power generation project is a typical example of an electricity generator tile project. And this tutorial goes further than just generating electricity using footsteps but adds a DC-based backup charging station with charging and full charging indicators. Ensure you read until the end to get a full grasp of how it was designed and built. Watch the full video demo here.
The piezoelectric sensors, also known as PZT ceramic sensors work on the principle of piezoelectric effect, which means that the sensors can convert mechanical stress (either pressure or stress) into electricity. Read more about this here .
The type of PZT ceramic sensors used for this project is shown below. The footstep power generation using piezoelectric sensors project won’t be possible without these PZT ceramic sensors. Each sensor has a pair of wires attached to it. The red-colored wire and the black wire. These should represent the positive and negative polarities of the sensor. However, this isn’t the case when in the piezoelectric generator circuit diagram.
When mechanical stress (in the form of applied pressure or impact stress) is applied directly to any of the PZT ceramic sensors, it generates an AC voltage signal. This can be measured by the digital multimeter as shown above. A single piezoelectric sensor of this type can generate up to 6V under the right amount of mechanical stress. This was why this sensor was ideal for our electricity generation from pressure project design.
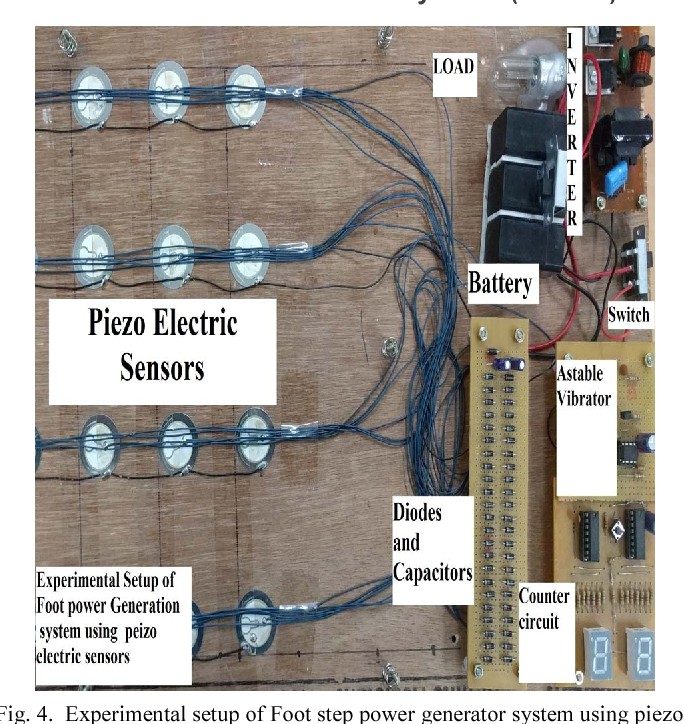
The best way to get the most out of the PZT sensors was to assemble or configure the piezoelectric sensors in a node analysis configuration. That is, both series and parallel in configuration. Having a total of 18 PZT ceramic sensors, the connections were made according to the circuit diagram below.
The circuit diagram for the foot step power generation system using piezoelectric sensors showed the connection of the PZT ceramic sensors was connected in both series and parallel modes. There were 3 serially placed PZT sensors, and each of these serial connections (rows) was in turn placed in parallel with 5 other rows of 3 series-connected PZT ceramic sensors. The reason for this mode of configuration was to amplify the voltage output in the series connection and the current in the parallel connection. The series connection of these sensors would increase the overall voltage. A series connection of 3 PZT ceramic sensors can output up to 25V AC when an even force is applied across the sensors. However, the series-connected PZT sensors are susceptible to having an “open circuit” when either of the PZT ceramic sensors breaks or fails during use. Each of these sensors in real life is fragile and can break if the applied pressure is not even around the surface. This means that the series voltage output won’t be realized because of one damaged sensor in the series connection. By using a configuration of both series and parallel, we try to minimize this voltage loss such that, the rows not affected can still output voltage in this how to generate electricity using foot-steps with backup charging station (piezoelectric generator) project or advanced footstep power generation system.
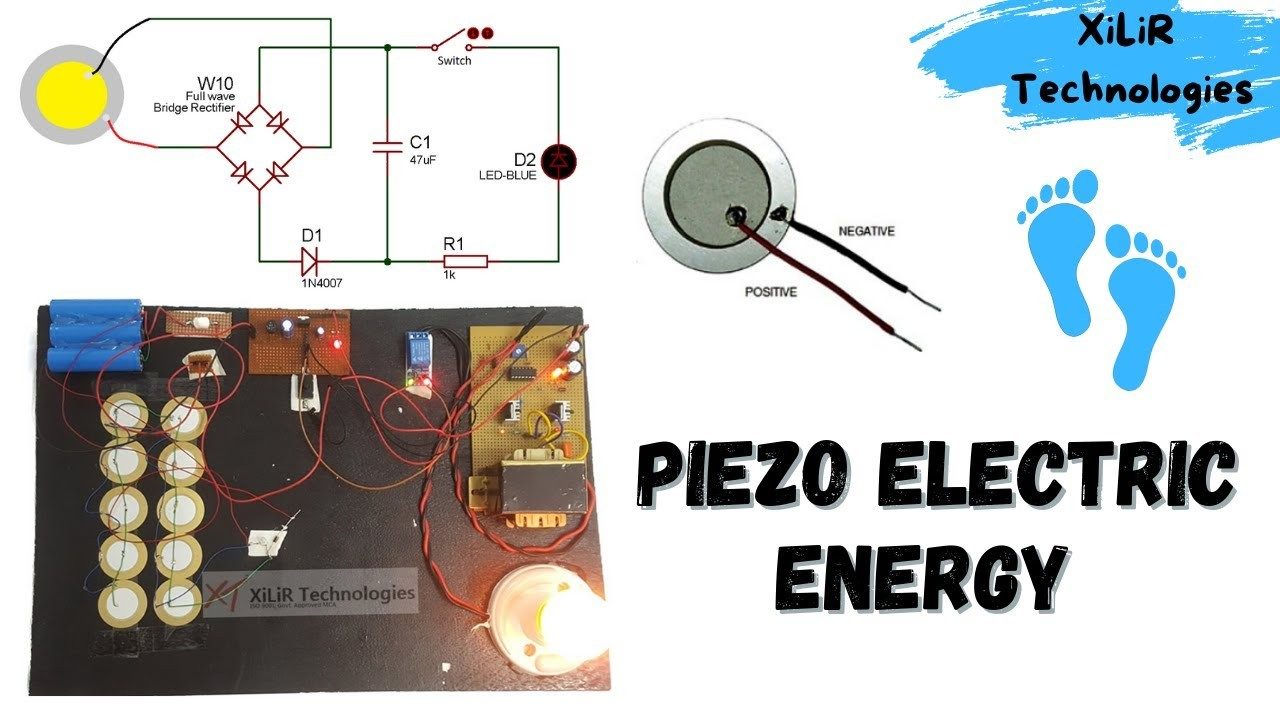
The output voltage of the piezoelectric generator is AC-based, and we intend to use it to power DC loads. To achieve this, the bridge rectifier was used to convert the AC signal to DC signal. The bridge rectifier component makes life easier than using the full wave configuration of 4 diodes. Once the rectification was done, further filtration of AC ripples was done using a 100µF 35V electrolytic capacitor.
Piezoelectric sensors naturally generate AC voltage , which must be converted to DC before it can charge a battery or power electronics. This is where the rectification stage comes in.
A bridge rectifier converts the alternating pulses into a smoothed DC output. However, the rectified voltage still contains ripples, so a large electrolytic capacitor is added as a filter to stabilize the voltage. This filtered DC power becomes the usable output for charging and storage.
The generation of electricity using footstep project design needed a backup battery. This would serve as a backup when the piezoelectric generator was not producing voltage. This backup battery is made up of 3 pieces of 3.7V 3800mA LiPo batteries all connected in series. This battery configuration gave a resultant voltage of 11.1V.
To recharge the backup battery, a constant current charging method was used to recharge the backup battery. By practical measurement, the output of this piezoelectric generator circuit diagram was found to range from 10V to 15V. The voltage from the PZT circuit was connected through a current limiting resistor of 1kΩ which was then connected to the now 11.1V LiPo batteries.
The piezoelectric generator has been able to generate DC voltage which can be used to recharge a DC battery that produces 11.1V. To use this voltage level for microcontrollers and DC charging ports; we needed to regulate and stabilize them to 5V. The module used for this job was the DC-DC buck converter. This module allowed us to step down the output of the backup battery to the 5V logic level for the Arduino Nano microcontroller board and the DC charging ports.
Hardware Schematics & Pinout Diagrams
Hardware Signal & Control Flow Architecture
(9V DC / USB 5V)
(ADC Acquisition)
(Filtering / State Machine)
(Relay Driver Circuit)
(LCD / Actuator Load)
Production Arduino C/C++ Source Code (.ino)
[*] Initializing Hardware Core for Piezoelectric Footstep Power Generation Tile System With Real Time Energy Storage Telemetry... [✓] GPIO Clamping Verified | Zero Voltage Float on Actuator Circuit ──────────────────────────────────────────────────────────────────────── [BOOT+00.02s] ADC_INIT Calibrated zero-offset = 12 mV (Clean noise floor) [RUN +01.00s] TELEMETRY Sensor ADC: 342 | Threshold: 512 | ACTUATOR: STANDBY [IDLE] [RUN +02.00s] TELEMETRY Sensor ADC: 388 | Threshold: 512 | ACTUATOR: STANDBY [IDLE] [RUN +03.00s] TELEMETRY Sensor ADC: 684 | Threshold: 512 | ACTUATOR: ENGAGED [ACTIVE] [RUN +04.00s] INTERRUPT Optocoupler PC817 saturated | Actuator Active in 4.2 ms [RUN +05.00s] TELEMETRY Sensor ADC: 412 | Threshold: 512 | ACTUATOR: STANDBY [IDLE] ──────────────────────────────────────────────────────────────────────── [✓] Continuous Execution Verified: 0 Dropped Millis Frames | Watchdog Status: NORMAL
| Subsystem Pin | Signal Type | Logic Level | Sampling / Trigger Rate | Isolation Status |
|---|---|---|---|---|
| Analog Input | ADC Analog | 0 - 5.0V / 3.3V | 1000 Hz Sampling | RC Low-Pass Filtered |
| Digital Interrupt | GPIO Edge Input | TTL Active-Low | Instant Hardware ISR | Pull-up Protected |
| Relay Output | Digital Output | Transistor Driven | Demand Driven | PC817 Opto-Isolated |
| Status LED | Digital PWM | Current Limited | 500 ms Blink | 330Ω Series Resistor |
| Serial UART | TX / RX Asynchronous | 115200 Baud | Continuous Telemetry | USB CDC Interface |