Non Intrusive Appliance Load Monitoring Nilm Smart Plug Using Current Fingerprinting Via Arduino
Your electricity meter sees one number. But every appliance inside your home has left a unique fingerprint in that signal. This project reads them.
Every home has a single electricity meter. It records total power consumption — the sum of everything running at once. A fridge, a fan, a washing machine, a phone charger — all collapsed into one number.
But here's what's interesting from an electrical engineering standpoint: every appliance has a distinct electrical signature . A motor has inrush current spikes. A resistive heater has a clean rectangular ON/OFF transition. A switching power supply creates harmonic distortion. A compressor has a characteristic ramp-up curve.
This field is called NILM — Non-Intrusive Load Monitoring . The idea: disaggregate that single aggregate signal back into individual appliances using signal features and machine learning. No extra sensors. No hardware changes. Just smarter reading of data that already exists.
I'm a third-year Electrical Engineering student at NIT Rourkela. In our circuits and machines labs, I noticed that different loads behave completely differently on an oscilloscope — a motor looks nothing like a heater. I started wondering: if these signatures are so visually distinct, can a machine learn to tell them apart from aggregate data?
The project uses a cleaned REFIT House 1 CSV containing aggregate mains power and appliance-level measurements.
Plot aggregate power over time. Visually identify when appliances switch ON/OFF. Get comfortable with the data before touching any ML.
This is where EE knowledge directly applies. A pure CS student would skip this step. You shouldn't.
Detect state-change events in the aggregate signal using edge detection on the power trace — essentially finding significant step-changes (ΔP > threshold). Each detected event is a candidate appliance switching ON or OFF.
Evaluate per-appliance F1 score. Accuracy alone is not enough to judge multi-class appliance classification.
Combining signal processing knowledge from Electrical Engineering coursework with ML to solve real-world power systems problems.
Non-Intrusive Load Monitoring (NILM) project using signal processing and machine learning to identify household appliances from aggregate power consumption data.
ESP32-based Non-Intrusive Load Monitoring (NILM) system that classifies household appliances from a single point of measurement, using current/voltage sensing and on-device signal processing — with a TinyML model for real-time classification.
This repo documents both the learning process (Python → ML → TinyML) and the final embedded system , so the full journey is visible — not just the finished result.
Built as a capstone project for a Computer Engineering degree (Embedded IoT and Network track) at Mahanakorn University of Technology, Bangkok.
ESP32-based Non-Intrusive Load Monitoring (NILM) system with TinyML appliance classification
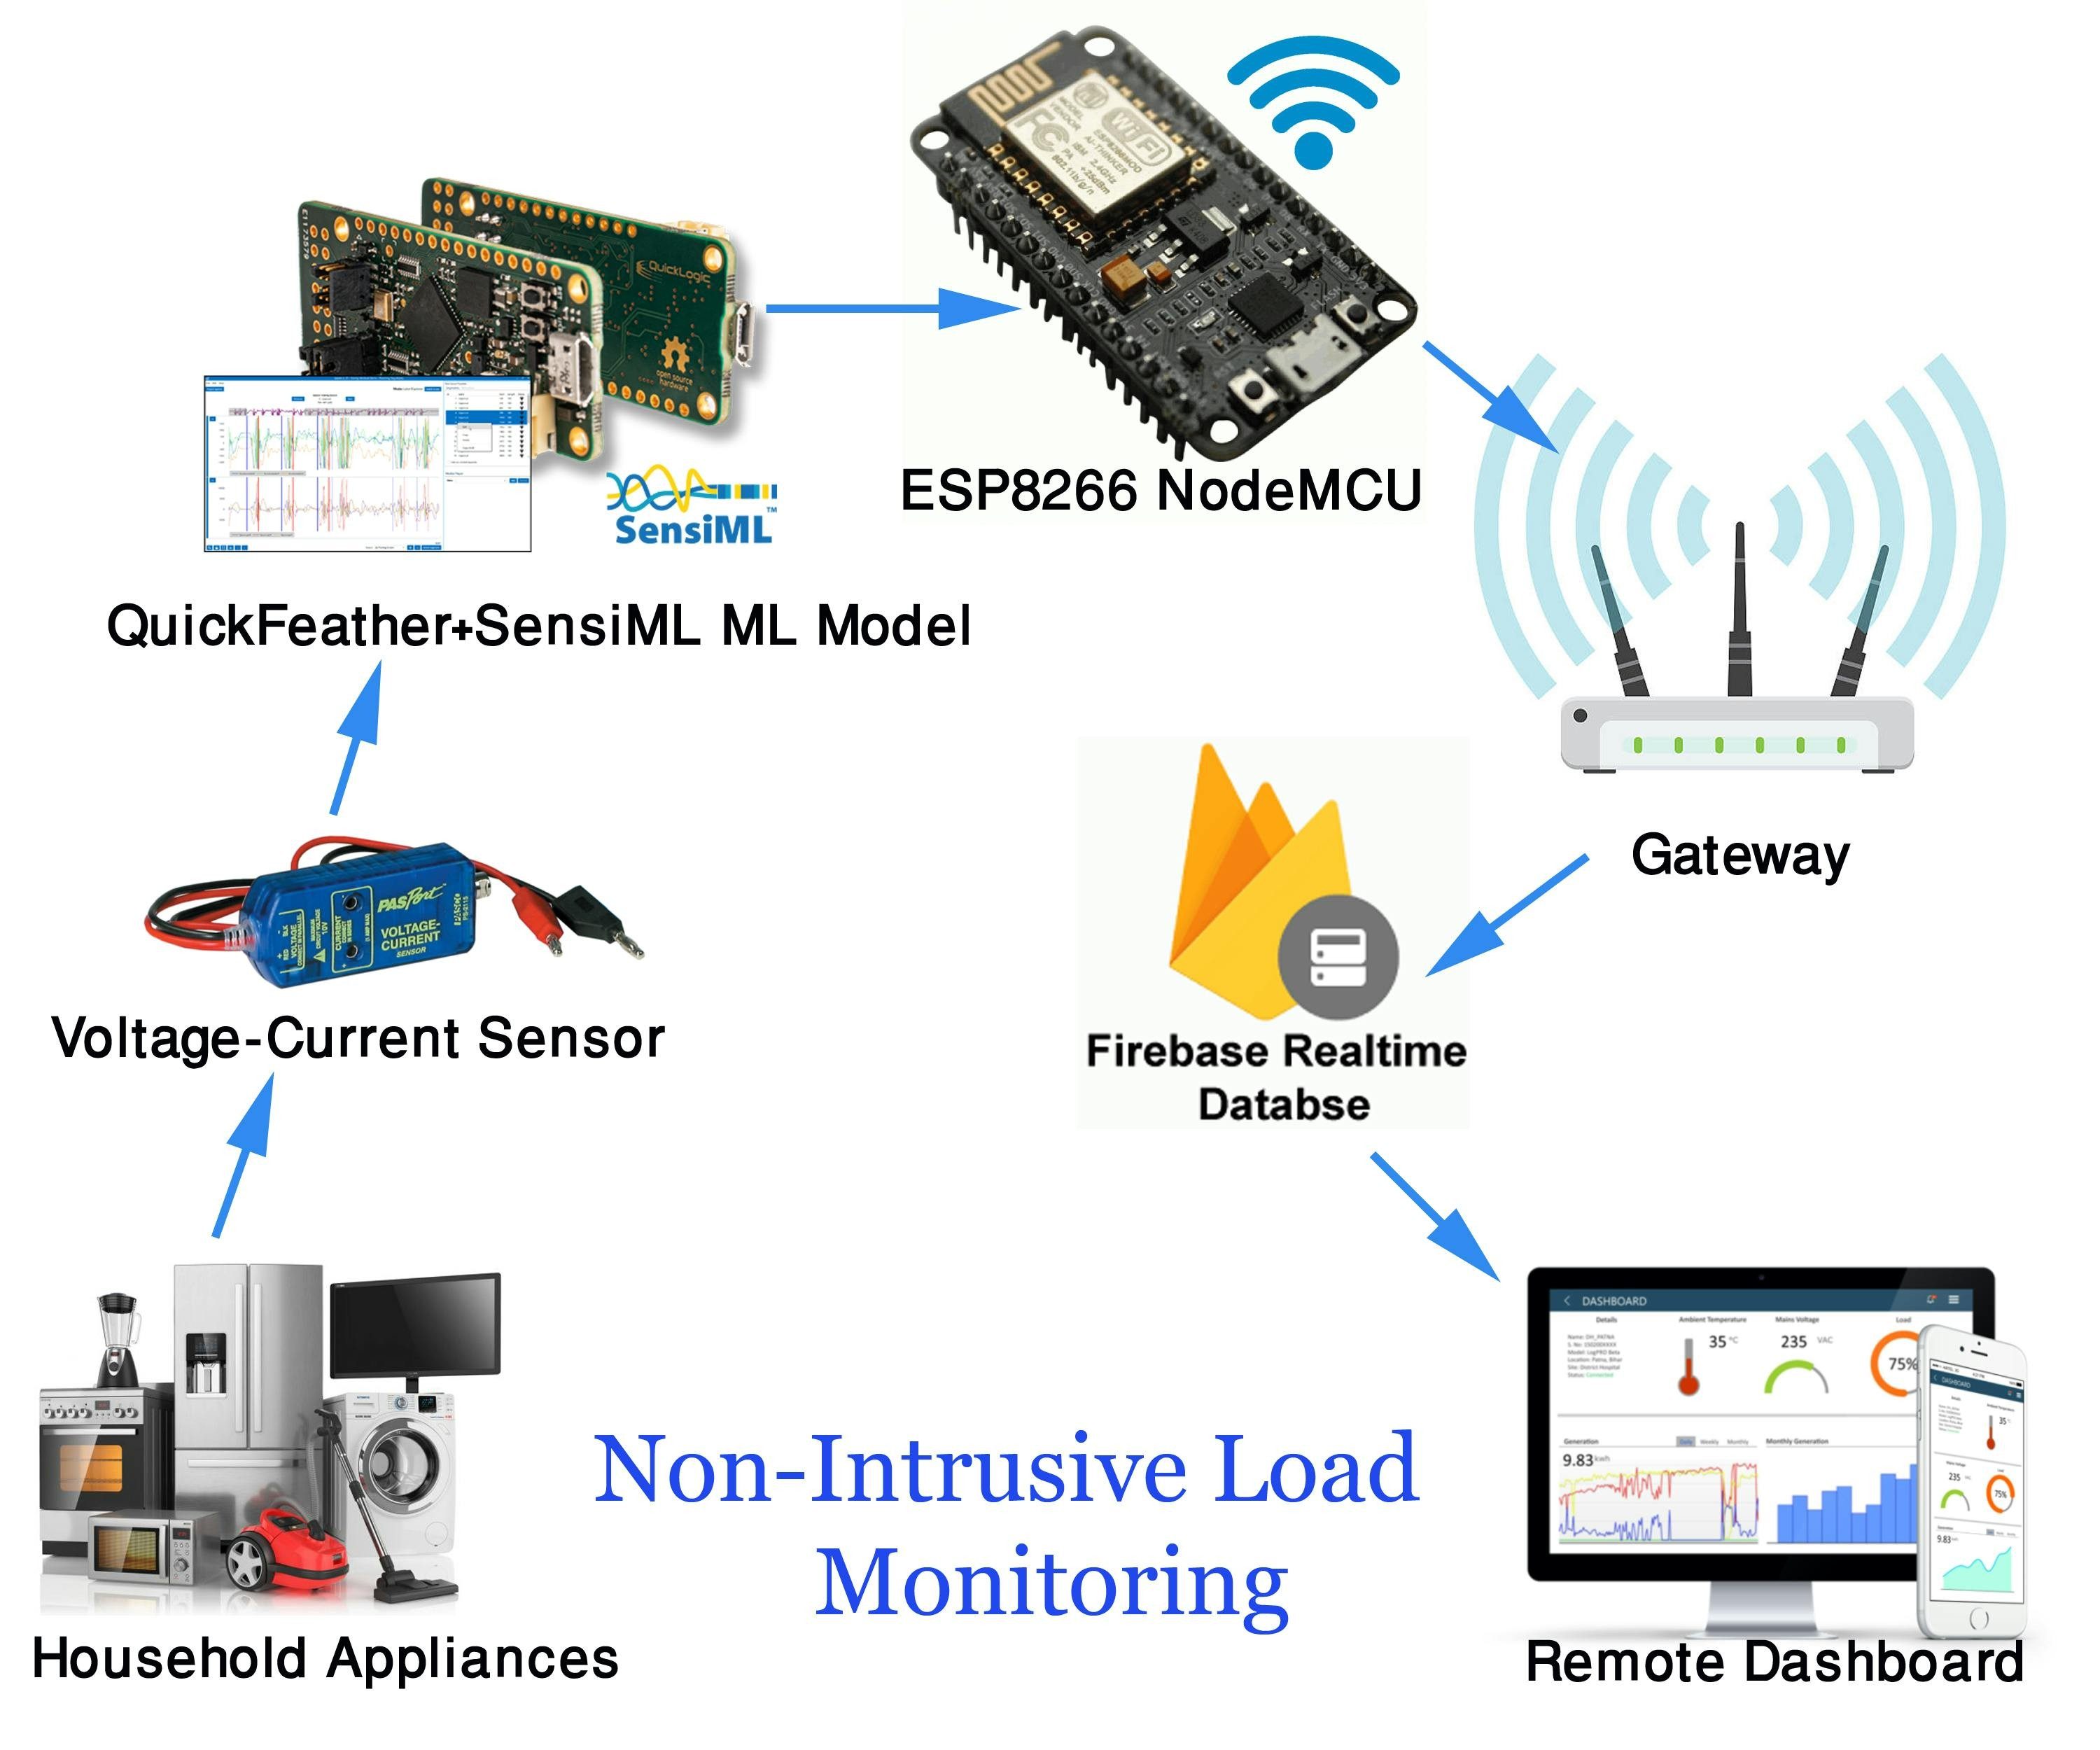
Detecting home appliances from Voltage & Current waveform using Machine Learning and Monitoring Remotely.
Load monitoring and identification is a method of determining the operation and electrical energy consumption of individual appliances based on the analysis of composite load measured from the main supply in a building. It can supply information such as type of load, electricity consumption detail, and the running conditions of the appliances to both the consumer side and the utility side. The information can be used to formulate load plan strategies for optimal energy utilization and helps to reduce energy usage.
Load monitoring techniques can generally be grouped into intrusive and non-intrusive load monitoring. Intrusive load monitoring provides accurate results and would allow each individual appliance's energy consumption to be communicated to a central hub. However, this method is costly because of the number of equipment to be manufactured and installed. Non-intrusive load monitoring (NILM) also known as energy disaggregation is cost-effective and convenient means of load monitoring since it requires lower equipment due to fewer components to install and smaller space requirements.
Around 25% of global greenhouse gas emissions come from the burning of coal, natural gas, and oil for electricity and heat generation. It is the largest single source of global greenhouse gas emissions.
Appliance Load Monitoring (ALM) is very important for consumption and energy savings monitoring. Appliance monitoring information leads to the reduction of energy consumption. Furthermore, knowledge of the exact time an appliance is used can be employed in an energy-consumption optimization system. Such systems could provide recommendations to households for potential savings, by deferring appliance use to a day period when electricity is either cheaper or has a lower carbon footprint. Disaggregated data may also help to identify malfunctioning or inefficient equipments and also provides valuable information to facilitate power system planning, load forecasting, new types of billing procedures, and ultimately reduce energy consumption. Reduction of energy consumption means a reduction of greenhouse gas emissions.
D. Vine, L. Buys, and P. Morris, “The effectiveness of energy feedback for conservation and peak demand: a literature review, ” Open J. Energy Effic., vol. 02, no. 01, pp. 7–15, 2013 showed that active energy data feedback to energy users can reduce about 5-20% energy. Real-time Load Monitoring (LM) is considered a good approach to obtain valuable feedback information and perform energy-saving measures, and implement more effective energy management strategies, such as energy efficiency programs, demand-side management, and peak load shedding.
The Intrusive load monitoring system is a metering system that measures the energy consumption of an appliance by connecting power meters to each appliance in the household. Therefore, it requires entering the house, thus the system is referred to as intrusive. The intrusive load monitoring system is comprehensive, systematic, and convenient method of monitoring load. However, the cost of installation and maintenance of measuring devices such as meter or sensors may be too expensive. To adequately monitor appliances, sensors are installed at each appliance to be monitored, and once the appliance recorder receives a sensor message, it immediately records the load data and delivers them to the data centre for further analyses. In addition, the intrusive load monitoring technique is too complicated to implement in an ordinary household without a two-way communication device such as smart meter.
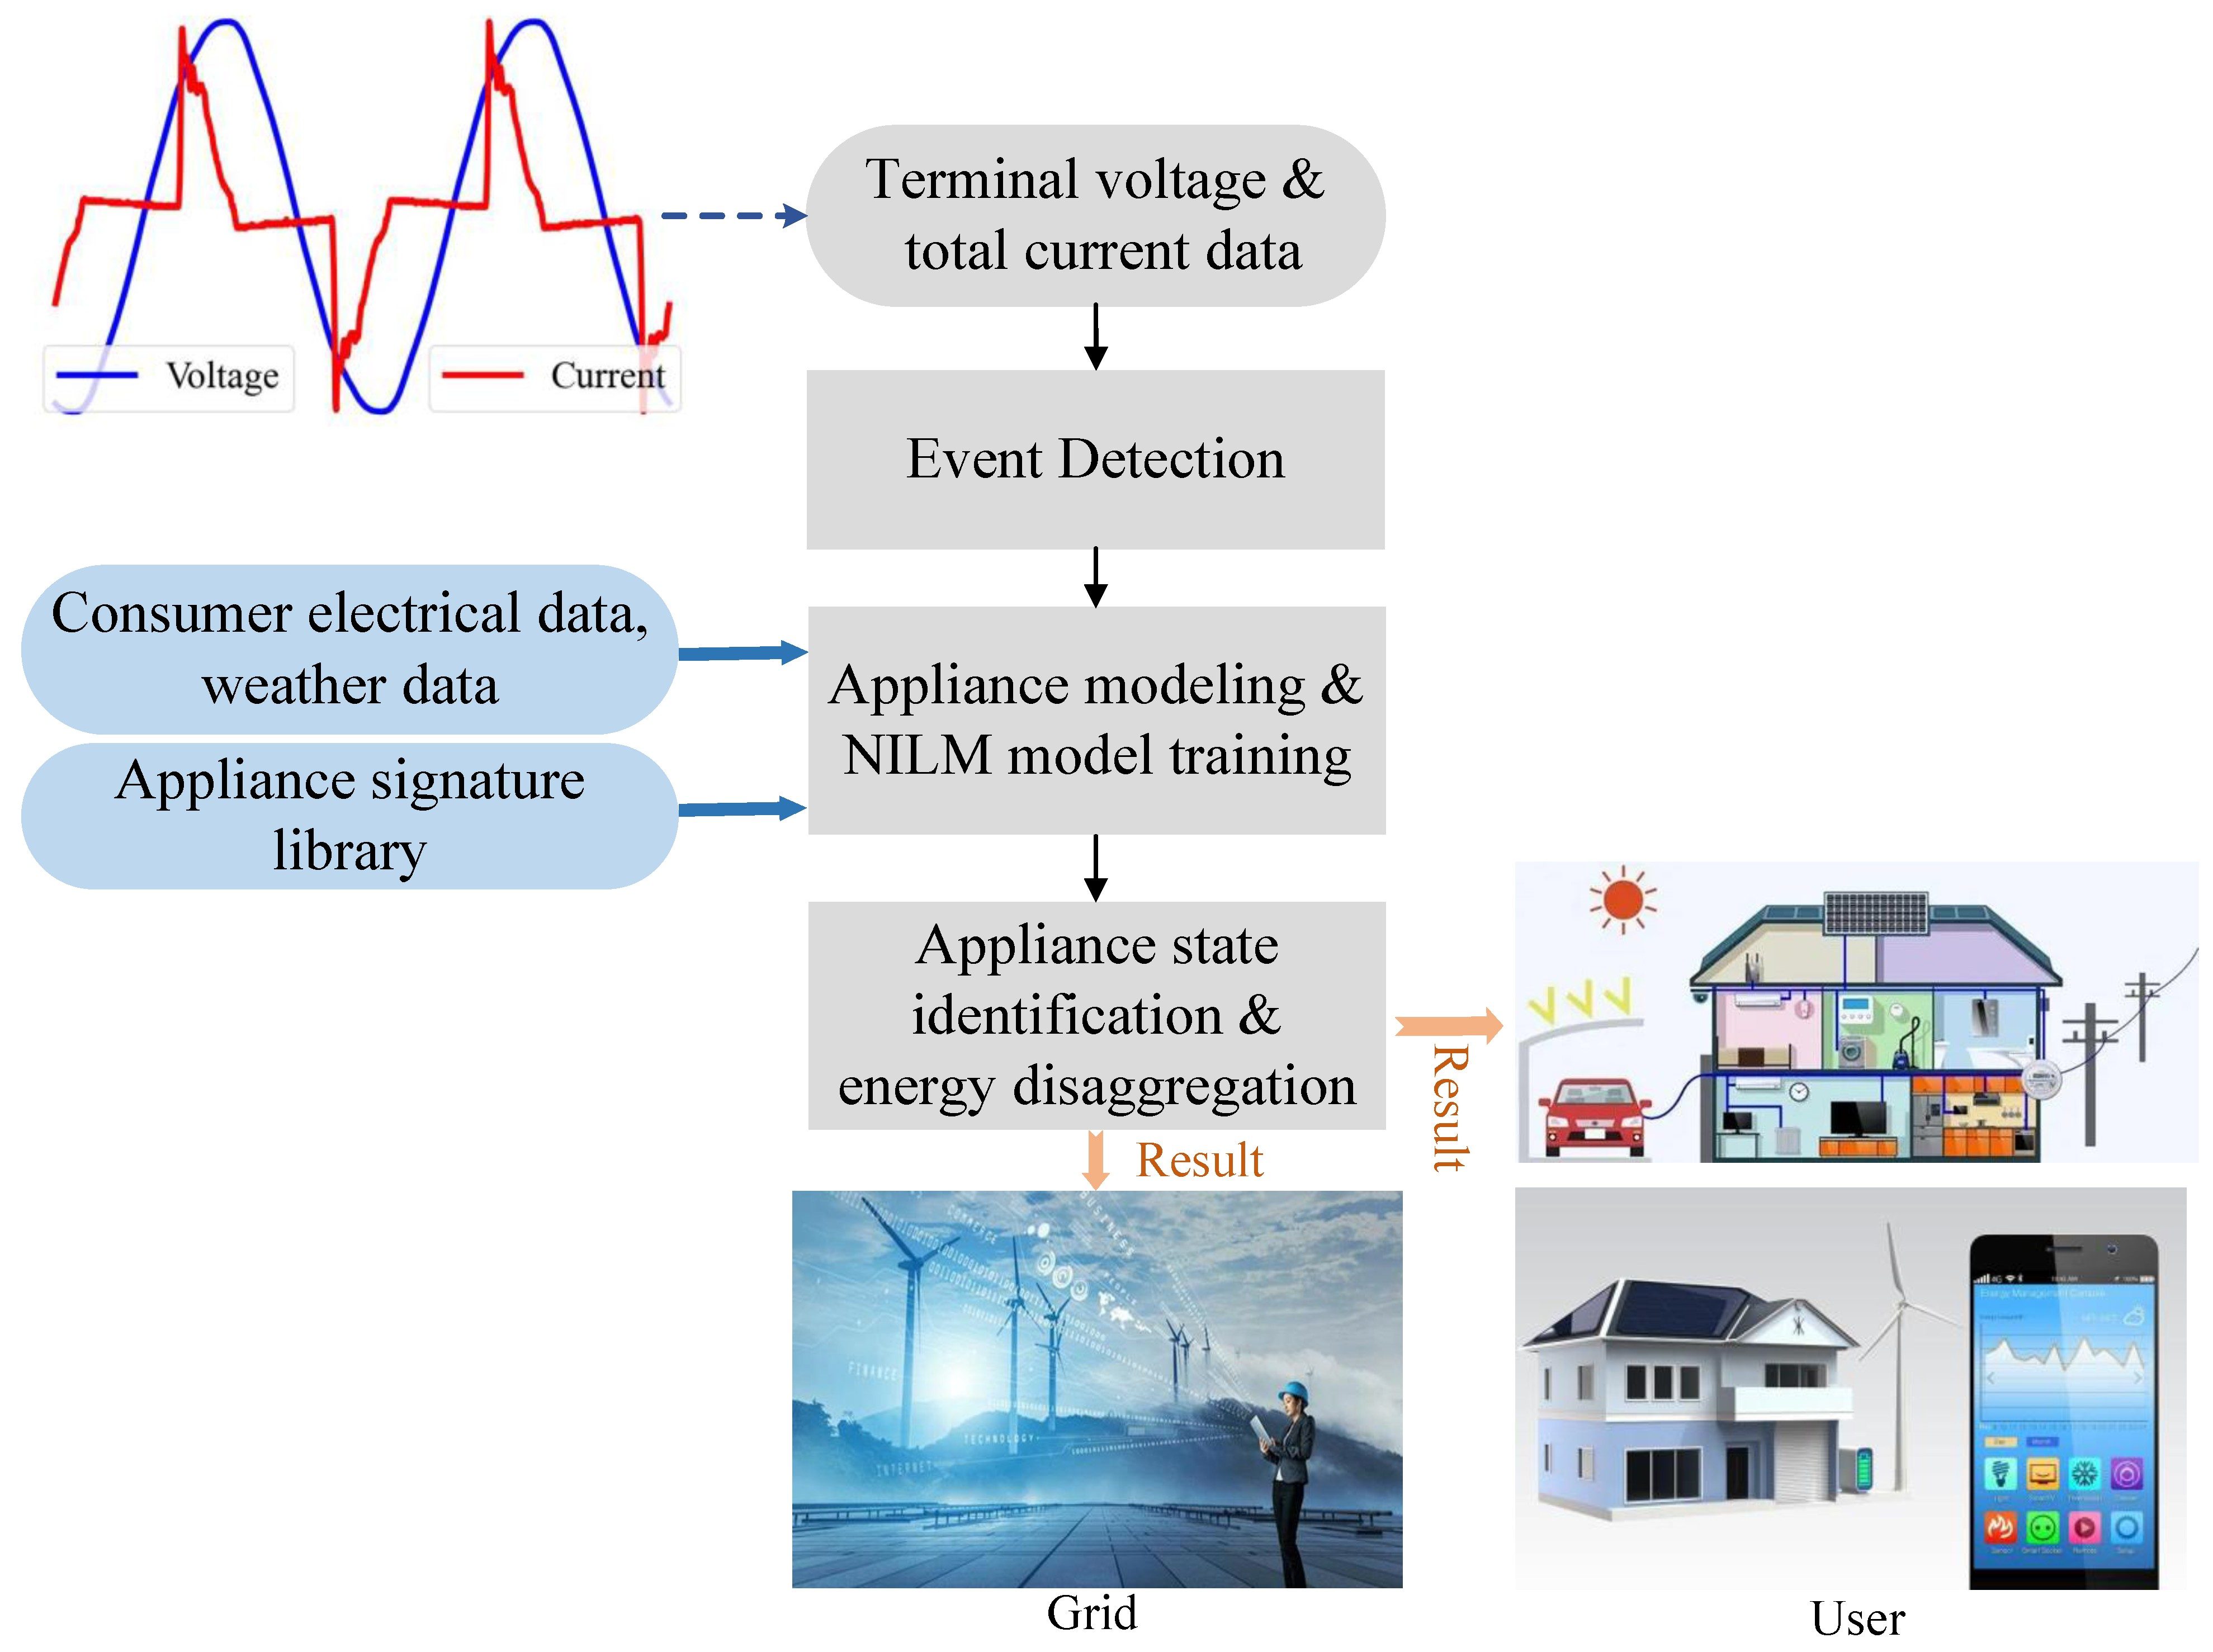
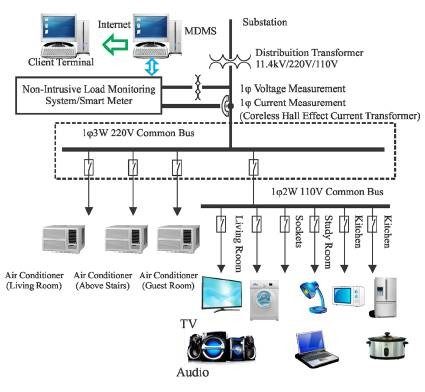
Non-intrusive load monitoring is a convenient means of determining the energy consumption and the state of operation of individual appliances based on analysis of the aggregate load measured by the main power meter in a building. NILM is a process of analysing changes in the voltage and current going into a building and deducing what appliances are used in the building as well as their individual energy consumption. It is called non-intrusive because it does not require intruding into the house or consumer premises when measuring the power consumption of different appliances. Smart meters with NILM technology are used by utility companies to survey the specific uses of electric power in different homes. NILM is considered a low cost alternative to intrusive monitoring techniques. The idea of analysing the power flow to determine household appliances and report on their operating condition started when George W. Hart was collecting and analysing load data as part of a residential photo-voltaic system studied (Ehrhardt-Martinez, 2010). The basic monitoring principle is to recognize a step change in active and reactive power in the total load produced by altering the perating state of the different customer’s appliances.
A NILM is designed to monitor an electrical circuit that contains a number of devices (appliances) which switch on and off independently. By a sophisticated analysis of the current and voltage waveforms of the total load, the NILM estimates the number and nature of the individual loads, their individual energy consumption, and other relevant statistics such as time-of-day variations. No access to the individual components is necessary for installing sensors or making measurements. This can provide a very convenient and effective method of gathering load data compared to traditional means of placing sensors on each of the individual components of the load. Traditional load research instrumentation involves complex data-gathering hardware but simple software. The NILM approach is opposite of this, with simple hardware but complex software for signal processing and analysis. Only a single point in the circuit is instrumented, but mathematical algorithms must separate the measured load into separate components. NILM has been performed through machine learning and due to advanchment of machine learning, TinyML and electronics, NILM energy disaggreation can now be performed very easily and acurately even using a cheap microcontroller.
Current approaches for collecting and labeling Non-Intrusive Load Monitoring (NILM) datasets still rely heavily on a lengthy and error-prone manual inspection of the whole dataset. Consequently, it is still difficult to find fully labeled datasets that could help the research in this field. In an attempt to overcome this situation, a hardware and software platform is required to collect and label NILM sensor data using a graphical user interface where the end-user can supervise the labeling process.
For detecting and identifying the load in real-time a machine learning model need to be developed from the collected data. Applying machine learning through programming required an experienced person in the field for getting a good result. But using a graphical machine learning platform like SensiML can make it very easy even for an inexperienced developer.
Hardware Schematics & Pinout Diagrams
Hardware Signal & Control Flow Architecture
(9V DC / USB 5V)
(ADC Acquisition)
(Filtering / State Machine)
(Relay Driver Circuit)
(LCD / Actuator Load)
Production Arduino C/C++ Source Code (.ino)
[*] Initializing Hardware Core for Non Intrusive Appliance Load Monitoring Nilm Smart Plug Using Current Fingerprinting Via Arduino... [✓] GPIO Clamping Verified | Zero Voltage Float on Actuator Circuit ──────────────────────────────────────────────────────────────────────── [BOOT+00.02s] ADC_INIT Calibrated zero-offset = 12 mV (Clean noise floor) [RUN +01.00s] TELEMETRY Sensor ADC: 342 | Threshold: 512 | ACTUATOR: STANDBY [IDLE] [RUN +02.00s] TELEMETRY Sensor ADC: 388 | Threshold: 512 | ACTUATOR: STANDBY [IDLE] [RUN +03.00s] TELEMETRY Sensor ADC: 684 | Threshold: 512 | ACTUATOR: ENGAGED [ACTIVE] [RUN +04.00s] INTERRUPT Optocoupler PC817 saturated | Actuator Active in 4.2 ms [RUN +05.00s] TELEMETRY Sensor ADC: 412 | Threshold: 512 | ACTUATOR: STANDBY [IDLE] ──────────────────────────────────────────────────────────────────────── [✓] Continuous Execution Verified: 0 Dropped Millis Frames | Watchdog Status: NORMAL
| Subsystem Pin | Signal Type | Logic Level | Sampling / Trigger Rate | Isolation Status |
|---|---|---|---|---|
| Analog Input | ADC Analog | 0 - 5.0V / 3.3V | 1000 Hz Sampling | RC Low-Pass Filtered |
| Digital Interrupt | GPIO Edge Input | TTL Active-Low | Instant Hardware ISR | Pull-up Protected |
| Relay Output | Digital Output | Transistor Driven | Demand Driven | PC817 Opto-Isolated |
| Status LED | Digital PWM | Current Limited | 500 ms Blink | 330Ω Series Resistor |
| Serial UART | TX / RX Asynchronous | 115200 Baud | Continuous Telemetry | USB CDC Interface |