Microcontroller Driven Solar Pv Fault Detection System Using String Current Voltage Anomaly Analysis
The program code embedded in the Arduino UNO board, which allows to acquire the measured data of PV panel from sensors and send it to a PLX-DAQ Spreadsheet, is presented as follows
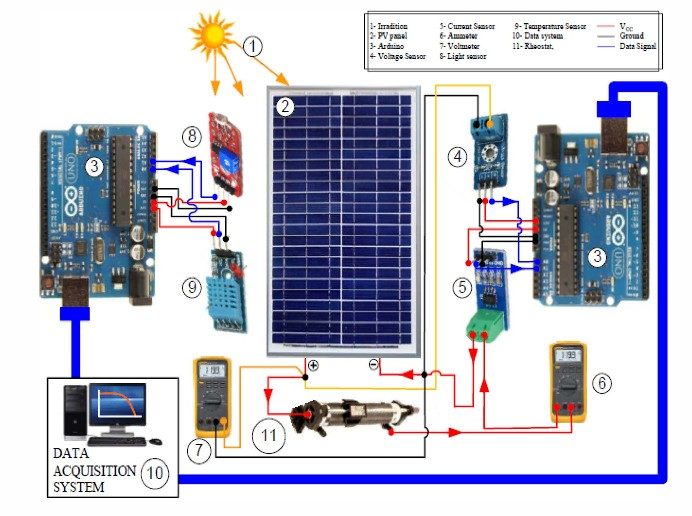
The microcontroller of Arduino board gets the PV panel output voltage and current which are measured by sensors and then computes the output power. Once the Arduino board is connected to the computer through a USB cable, we launch the PLX-DAQ Excel Macro and by defining in the PLX-DAQ window after its display, the serial port where Arduino board is connected to the computer, and the Baud rate (9600 bit/sec). Note that the Baud rate defined in PLX-DAQ window must be the same as that used in the program code embedded in Arduino board. Thereafter, after clicking on "connect" the output data will be collected and displayed in real-time on the Excel Spreadsheet. The light intensity is driven by varying manually a variable resistance between 0 and 330 Ω (to trace the I-V and P-V characteristics). A pyranometer is also used to measure the light radiation (if needed!). The microcontroller is programmed to measure successively in each second the PV current, voltage and power.
The results of a monitoring test for current, voltage and power of PV panel are presented in the Figure below. From the experimental results, it can be seen that the PV panel produced a maximum power of 17.07 W at "15h14min02s" when a voltage of 14.15 V and a current of 1.20 A appear. Subsequently, the output power is tends to a minimum value 822.2 mW when there is a voltage of 18.23 V and a current of 45.1 mA. Hence, as the present system is used such as a virtual instrument to acquire the PV panel characteristics under the real operation conditions, it can also be used on field periodical monitoring activities for PV systems.
The results of a test similar to the previous one are shown in the Figure below, while the difference relates to the time step between each measurement, decreasing the step size from 1 s to only 100 ms. As shown in this Figure, oscillations have appeared on the I-V and P-V curves due to the inaccuracy of data obtained by the instrument system but with small extent. However, a small step size leads to obtain a big sample of measurements, and hence give us too many significant results. As a result, a compromise between small and large step size is needed. Generally, if you would like to note precise changes in the PV characteristics, then it is recommended to use a smaller step size. If you are not concerned about the precise changes and would like to run the instrument system faster, use a large step size.
The voltage sensor is put in parallel with the load. While the current sensor module is put in series between the positive side of the PV panel and that of the load.
The PLX-DAQ Excel Macro is used for data acquisition from the Arduino microcontroller to an Excel Spreadsheet. We only need to download it. After installation, a folder named "PLX-DAQ" will automatically be created on the PC in which a shortcut named "PLX-DAQ Spreadsheet" is inside. Then, to establish the communication between the board and Excel, we just need to open the Spreadsheet and defining the connections settings (Baud rate and port) in the PLX-DAQ window.
The I-V and P-V characteristics of the PV panel obtained by our virtual instrumentation are presented in the Figure below.
In the Figure below, the experimental setup of the real-time virtual instrumentation system is shown. Apart PV panel, Arduino UNO board, voltage and current sensor, different components are used in the experimental setup such us lamps of 100 W that act as a solar simulator, a variable resistance between 0 and 300 Ω as a load and acting as a light intensity driving. The microcontroller's operation is programmed in the block diagram to measure the values relative to the current and the voltage captured by the sensors successively every 100 ms. Once the Arduino board is connected to the computer through USB cable, we launch the software interface of our system under LabVIEW. Then, we defined in the visa block the serial port where the Arduino board is connected to the computer. Thereafter, after the execution of the program, the output data will be plotted in real-time on the monitoring interface under LabVIEW.
The overview of the block diagram and the front panel of the virtual instrumentation system is shown in the Figure below. For enriching understanding, the block diagram is separated into four parts. The first one illustrates the blocks of initialization and configuration of the serial connection between the hardware (Arduino UNO) and software (LabVIEW), that by defining the type of used Arduino (Arduino UNO), type of serial communication (USB) and the Baud Rate (9600 bits per second). In the second part, the voltage and current readings will be obtained from the microcontroller by using the analog read function in LIFA's palette in which the initialization of the selected Arduino pins as inputs was made, A0 pin for voltage reading and A1 pin for current reading. The third part shows that the current, voltage and output power readings are carried out and will be plotted directly according to time by using scrolling graphs in the LabVIEW palette. Note that the reading of the voltage is multiplied by 5 because as it is demonstrated in the hardware part that the voltage reading by the microcontroller varies between 0 and 5 V, it is necessary to multiply it by 5 to obtain the PV panel's output voltage. The PV panel's output power reading is done out by the product of the current and voltage reading. Finally, in the last part, the I-V and P-V curves of PV panel characteristics will be plotted in the monitoring interface of the system by using x/y graphs in the LabVIEW palette.
Hardware Schematics & Pinout Diagrams
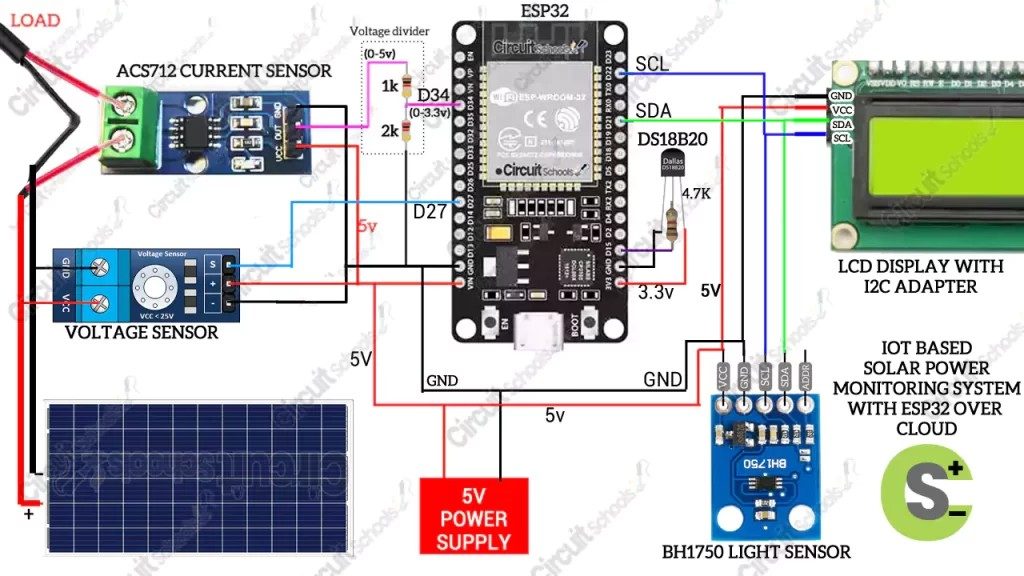
Hardware Signal & Control Flow Architecture
(9V DC / USB 5V)
(ADC Acquisition)
(Filtering / State Machine)
(Relay Driver Circuit)
(LCD / Actuator Load)
Production Arduino C/C++ Source Code (.ino)
[*] Initializing Hardware Core for Microcontroller Driven Solar Pv Fault Detection System Using String Current Voltage Anomaly Analysis... [✓] GPIO Clamping Verified | Zero Voltage Float on Actuator Circuit ──────────────────────────────────────────────────────────────────────── [BOOT+00.02s] ADC_INIT Calibrated zero-offset = 12 mV (Clean noise floor) [RUN +01.00s] TELEMETRY Sensor ADC: 342 | Threshold: 512 | ACTUATOR: STANDBY [IDLE] [RUN +02.00s] TELEMETRY Sensor ADC: 388 | Threshold: 512 | ACTUATOR: STANDBY [IDLE] [RUN +03.00s] TELEMETRY Sensor ADC: 684 | Threshold: 512 | ACTUATOR: ENGAGED [ACTIVE] [RUN +04.00s] INTERRUPT Optocoupler PC817 saturated | Actuator Active in 4.2 ms [RUN +05.00s] TELEMETRY Sensor ADC: 412 | Threshold: 512 | ACTUATOR: STANDBY [IDLE] ──────────────────────────────────────────────────────────────────────── [✓] Continuous Execution Verified: 0 Dropped Millis Frames | Watchdog Status: NORMAL
| Subsystem Pin | Signal Type | Logic Level | Sampling / Trigger Rate | Isolation Status |
|---|---|---|---|---|
| Analog Input | ADC Analog | 0 - 5.0V / 3.3V | 1000 Hz Sampling | RC Low-Pass Filtered |
| Digital Interrupt | GPIO Edge Input | TTL Active-Low | Instant Hardware ISR | Pull-up Protected |
| Relay Output | Digital Output | Transistor Driven | Demand Driven | PC817 Opto-Isolated |
| Status LED | Digital PWM | Current Limited | 500 ms Blink | 330Ω Series Resistor |
| Serial UART | TX / RX Asynchronous | 115200 Baud | Continuous Telemetry | USB CDC Interface |