Microcontroller Based Insulation Resistance Monitor For High Voltage Ev Traction Buses
This repository designs a system that monitors the insulation resistance of electrical cars. The develop environment is as follows:
####Microcontroller for experiment: AT90CAN128 ####Simulation: Protues( with Atmega128);
This is the system that monitors insulation resistance of electrical vehicles designing both hardware circuit and software components.
Pin and test socket connection data are available in documentation folder in file PinoutConnectionsTables.md
The meter outputs to an LCD and serial monitor. (The LCD is optional as data is sent via serial monitor to PC) Every point in code that requires User calibration on Initial build is marked "USER CALIBRATE"
Example output for Capacitor test 2 on a 10uF capacitor to LCD and serial monitor.
Each Arduino capacitance test relies on a property of resistor capacitor (RC) circuits- the time constant. The time constant of an RC circuit is defined as the time it takes for the voltage across the capacitor to reach 63.2% of its voltage when fully charged:
Larger capacitors take longer to charge, and therefore will create larger time constants. The capacitance in an RC circuit is related to the time constant by the equation:
The capacitance meter has an RC circuit with known resistor values and an unknown capacitor value. The Arduino will measure the voltage at the capacitor and record the time it takes to reach 63.2% of it’s voltage when fully charged (the time constant). Since the resistance value is already known, we can use the formula above in a program that will calculate the unknown capacitance.
Test 1: Range 1 uF to 4F. Uses two digital pins, one analog pin, and two resistors. One for discharge, one for charge. Insert a capacitor in range into terminal press button and view result on LCD or serial monitor. The Capacitor is charged, We can measure elapsed time until time constant fulfilled using analog pin and we know R value. Therefore we solve for C. The result gives two values: Capacitance value and time constant to test in mS. The user can adjust the 10K resistor value in code variable(resistorValue) to match exact value, to improve accuracy.
This capacitance test has the greatest range of 3. It also had the highest accuracy with smaller capacitors. No resistors are needed and it only uses two analog pins(A2(neg) and A3(positive) from the Arduino. There is no extra resistor just the internal components of ATmega328 chip.
The internal analog pin capacitor to gnd (C1) varies between 20 and 30pF. unknown capacitor = Cu. The positive pin is set to 5V, the negative to 0V.
The value of C1 for any given Arduino board will have to be calibrated using a known cap for Cu, for full accuracy I set it at 24.48pF in code (CapOne) Found using equation.
Where Va2 is ADC value reported by code and VA3 is 5v or 1023. So for a known capacitor of 103pF giving a ADC value of 801.
The user should change this for their system to improve accuracy. Test a known cap get ADC value and then pop these values into equation above and put the C1 value into (CapOne) variable in code.
So we want to charge the capacitor under test with a suitable voltage (eg. 5V from an Arduino output pin) and measure how long it takes to reach 63.2% of that voltage. So we need a reference voltage of 5 * 0.632, namely 3.16V. The internal analogue comparator is used for this job.:
We connect the reference voltage to the AIN1 pin (negative reference) and connect our capacitor to the AIN0 pin (positive reference) and then configure an interrupt on the rising edge. A value of 10K for the resistor to give a reasonably slow charge time. The value of ~ 10K is specified in code variable (resistance). so adjust for your resistor value. Make sure to pick accurate resistors for voltage divider.
The resistors used in circuit should be measured on good quality meter and there exact values added to code for maximum accuracy. This Resistance test can auto-range in both directions.
A voltage divider is made of two Resistances (R1 and R2) in series. The output voltage in the middle point is [R2/(R1+R2)]Vin. Using this formula and knowing the value of R2 and measuring the Vout calculate the resistance of R1. Vin will be 5 volts from the Arduino, We can measure Vout with one of the Arduino's analog inputs. We need to use different ranges of R2 to measure with better precision.
This tests range is from 80uH to 30,000uH. Ideally the capacitors in circuit must be in specification and measured on a good quality meter. The unknown test inductor is placed in parallel with a capacitor thus creating an LC circuit.
As soon as the voltage on the LC circuit becomes positive, the LM393 will be floating, which can be pulled high with a pull up resistor. When the voltage on the LC circuit becomes negative, the LM393 will pull its output to ground.
A 5V pulse signal from Arduino is applied to the LC circuit. We charge the circuit for some time. Then we change the voltage from 5 volts directly to 0. That pulse will make the circuit resonate creating a sinusoidal signal oscillating at the resonant frequency. The frequency is measured and later using the formulas we can obtain the inductance value. We will use the Arduino to measure the frequency and calculate the value. The resonant frequency is measured with the next equation:
So we could obtain the L value because we know the F frequency that we've just measured and we also know the value of the capacitor because it's a component that we've selected. All we need is to obtain L from this equation.
The comparator will turn the sine wave into a square wave with a duty of 50%(see fig 9 in datasheet ), The microcontroller measures the signal , This measurement can then be doubled to get the period and the inverse of the period is the frequency. Since the circuit is resonating, this frequency is the resonating frequency.
LCR meter project. An Inductance, Capacitance and Resistance meter, Arduino NANO(v3) based.
Hardware Schematics & Pinout Diagrams
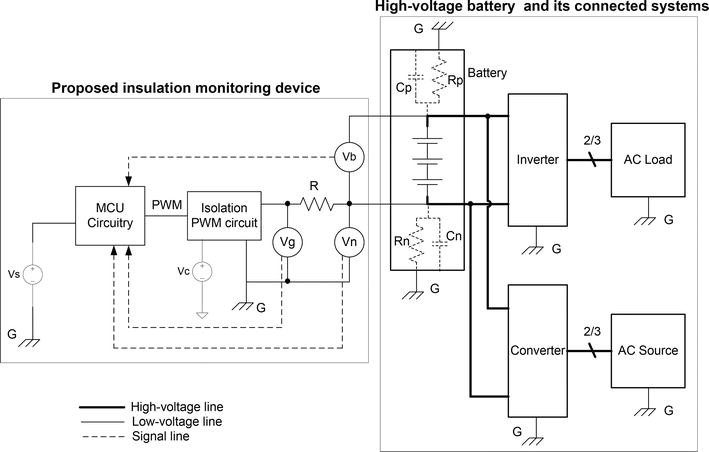
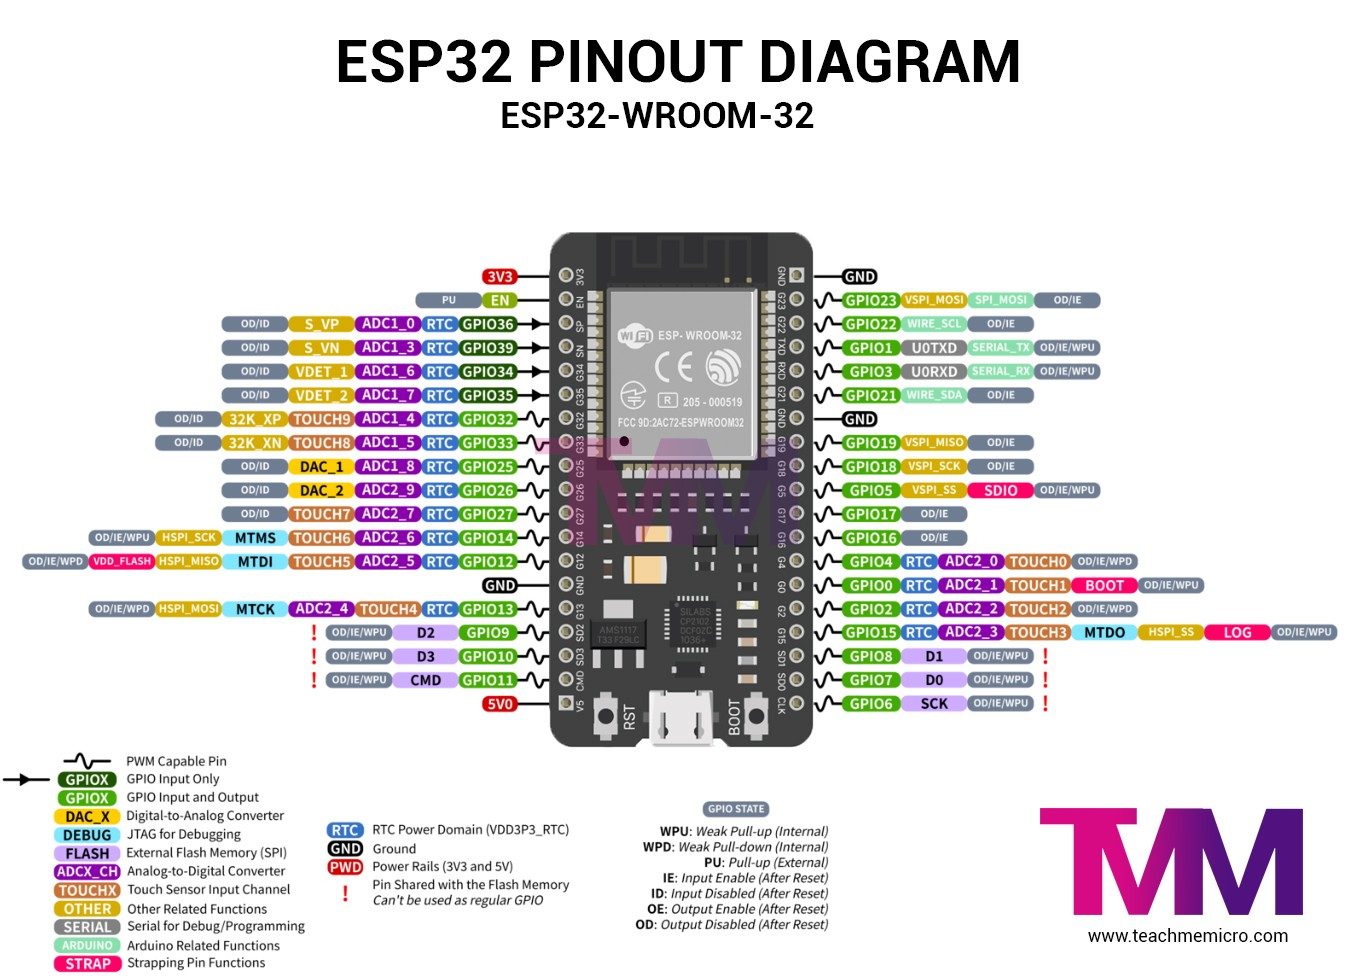
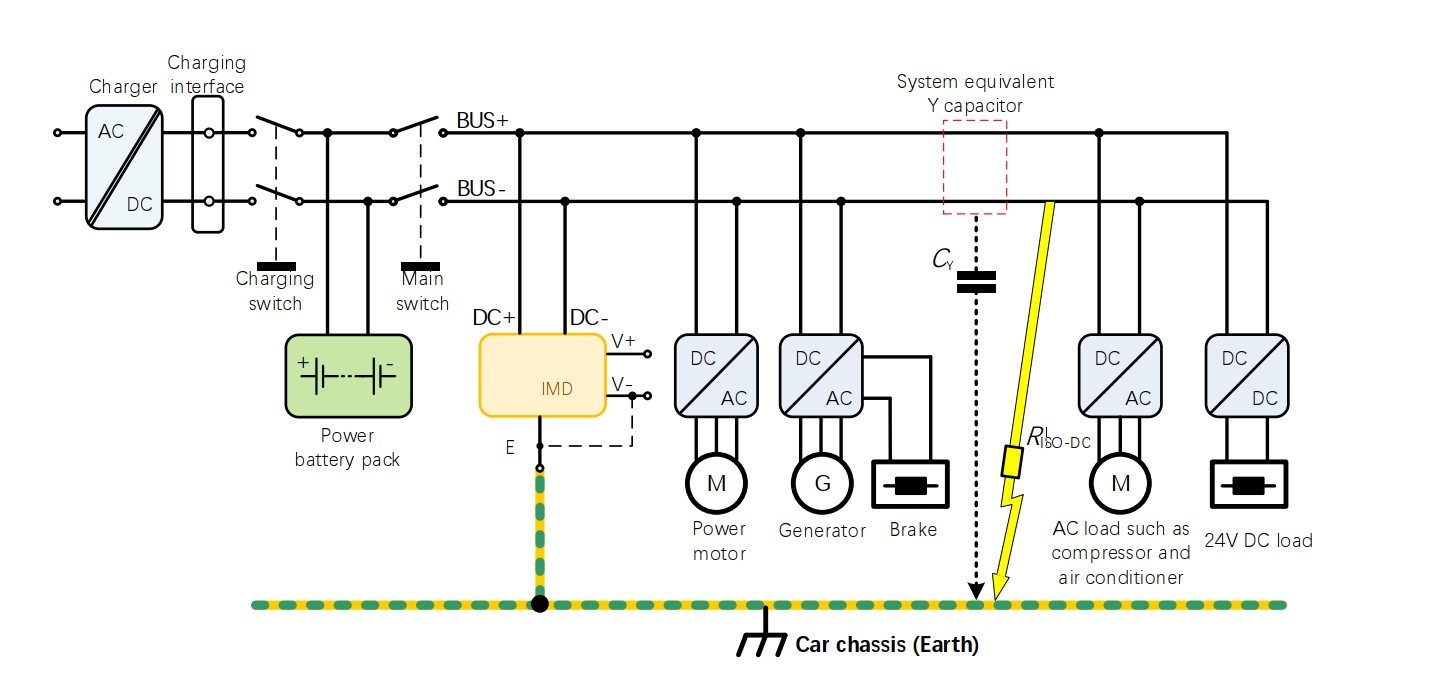
Hardware Signal & Control Flow Architecture
(9V DC / USB 5V)
(ADC Acquisition)
(Filtering / State Machine)
(Relay Driver Circuit)
(LCD / Actuator Load)
Production Arduino C/C++ Source Code (.ino)
[*] Initializing Hardware Core for Microcontroller Based Insulation Resistance Monitor For High Voltage Ev Traction Buses... [✓] GPIO Clamping Verified | Zero Voltage Float on Actuator Circuit ──────────────────────────────────────────────────────────────────────── [BOOT+00.02s] ADC_INIT Calibrated zero-offset = 12 mV (Clean noise floor) [RUN +01.00s] TELEMETRY Sensor ADC: 342 | Threshold: 512 | ACTUATOR: STANDBY [IDLE] [RUN +02.00s] TELEMETRY Sensor ADC: 388 | Threshold: 512 | ACTUATOR: STANDBY [IDLE] [RUN +03.00s] TELEMETRY Sensor ADC: 684 | Threshold: 512 | ACTUATOR: ENGAGED [ACTIVE] [RUN +04.00s] INTERRUPT Optocoupler PC817 saturated | Actuator Active in 4.2 ms [RUN +05.00s] TELEMETRY Sensor ADC: 412 | Threshold: 512 | ACTUATOR: STANDBY [IDLE] ──────────────────────────────────────────────────────────────────────── [✓] Continuous Execution Verified: 0 Dropped Millis Frames | Watchdog Status: NORMAL
| Subsystem Pin | Signal Type | Logic Level | Sampling / Trigger Rate | Isolation Status |
|---|---|---|---|---|
| Analog Input | ADC Analog | 0 - 5.0V / 3.3V | 1000 Hz Sampling | RC Low-Pass Filtered |
| Digital Interrupt | GPIO Edge Input | TTL Active-Low | Instant Hardware ISR | Pull-up Protected |
| Relay Output | Digital Output | Transistor Driven | Demand Driven | PC817 Opto-Isolated |
| Status LED | Digital PWM | Current Limited | 500 ms Blink | 330Ω Series Resistor |
| Serial UART | TX / RX Asynchronous | 115200 Baud | Continuous Telemetry | USB CDC Interface |