Microcontroller Based Electronic Honeybee Hive Health Monitor Using Audio Frequency And Weight Sensors
Pollinators are foundational to global food systems, biodiversity, and ecosystem resilience. Honeybees and other pollinators contribute to agricultural productivity, wild plant reproduction, ecological stability, seed formation, fruit production, and food-system resilience. Yet pollinator populations face pressure from habitat loss, pesticide exposure, parasites, disease, climate variability, nutritional stress, land-use change, invasive species, and fragmented landscapes.
An Arduino beehive monitoring system provides a practical way to observe hive conditions using low-cost embedded electronics. By combining temperature, humidity, and hive-weight sensing, beekeepers, educators, researchers, conservation groups, and advanced makers can collect time-series data that helps reveal colony conditions without requiring constant physical inspection.
This project demonstrates how to build an Arduino-based beehive monitoring station capable of collecting environmental and weight data from a hive or simulated hive platform. While simple, the system reflects a broader sustainability principle: ecosystems become easier to protect when ecological conditions can be measured clearly, carefully, and responsibly . Sensor-based monitoring can support SDG 15: Life on Land , but it must remain grounded in bee welfare, field safety, calibration, beekeeper judgment, and ecological context.
Arduino-based beehive monitoring system measuring hive temperature, humidity, and weight to help track colony health and support SDG 15: Life on Land.
This project also connects to broader site areas, including Environmental Monitoring Systems , Intelligent Infrastructure Systems , Biosphere Integrity and the Stability of Life Systems , Land-System Change and Ecological Transformation , Climate Change as a Planetary Boundary , Sustainable Development Goals Within Planetary Boundaries , and Planetary Boundaries . In that wider context, this beehive monitoring system is not only a maker project. It is a small prototype of the ecological sensing infrastructure needed to observe pollinator health, habitat stress, food-system resilience, and biodiversity conditions more carefully.
This project presents a prototype Arduino beehive monitoring system built around temperature, humidity, and hive-weight sensing. The system uses a DHT22 sensor to monitor internal or hive-adjacent environmental conditions and an HX711 load-cell amplifier to estimate hive weight. These measurements can be printed to the Serial Monitor, logged to an SD card, transmitted wirelessly, or extended into a dashboard-based pollinator monitoring workflow.
From an engineering perspective, the build demonstrates a compact ecological monitoring node with sensing, calibration, telemetry, data-logging, enclosure, and power-management layers. From a sustainability perspective, it illustrates how low-cost embedded systems can support pollinator health, biodiversity monitoring, and SDG 15-aligned ecological observation.
The system is intentionally limited. It is not a complete diagnostic platform for colony health, not a substitute for experienced beekeeping, not a veterinary or pest-management tool, and not a replacement for in-person hive inspection when inspection is needed. Its value is educational, methodological, and practical: it makes hive conditions more visible while teaching the measurement discipline required for responsible ecological monitoring.
This project aligns most directly with SDG 15: Life on Land , which emphasizes protecting, restoring, and sustainably managing terrestrial ecosystems and biodiversity. Pollinators are central to that goal because they support wild plant reproduction, agricultural productivity, habitat resilience, and ecological continuity across landscapes.
The project is not a biodiversity monitoring program by itself and should not be treated as one. Its contribution is narrower and still valuable: it demonstrates how low-cost sensing can help observe conditions inside or around managed hives. Temperature, humidity, and weight data can provide early signals of environmental change, resource shifts, hive activity, possible disturbance, and management needs when interpreted with beekeeping expertise.
The strongest SDG connection is SDG 15 . Pollinator health is part of biodiversity protection. A beehive monitoring system does not measure all pollinator diversity, and honeybee data should not be mistaken for the condition of all wild pollinators. Still, managed hive telemetry can help illustrate how ecological conditions are measured and why pollinator systems require sustained observation.
The connection to SDG 2 comes through food systems. Pollinators contribute to the production of many crops and support broader food-system resilience. Hive weight trends can provide indirect information about nectar flows, foraging conditions, and resource availability, while temperature and humidity data can help identify internal environmental stress.
The connection to SDG 9 comes through ecological infrastructure. Monitoring systems are part of the infrastructure of conservation and agriculture. Sensors, data loggers, telemetry networks, dashboards, and calibration protocols help translate ecological signals into practical information.
The connection to SDG 13 is indirect but important. Pollinators are affected by heat, drought, changing flowering times, weather extremes, and land-use pressures that interact with climate change. Hive telemetry can help compare colony conditions with local weather and seasonal patterns, especially when data is collected consistently over time.
Because the Sustainable Development Goals are broad public frameworks, it is important not to overclaim. This project is not a professional pollinator-health diagnostic system, not a disease detector, not a parasite-monitoring tool, and not a substitute for ecological research or beekeeper inspection. Its value is educational, methodological, and practical: it teaches the sensing-and-interpretation logic behind pollinator monitoring while emphasizing responsible use.
In that sense, the project works best as a bridge between sustainability language and ecological engineering practice. It turns a broad goal — protect biodiversity and pollinator systems — into a practical sequence: measure hive temperature, track humidity, estimate hive weight, calibrate sensors, log trends, compare readings with field observations, reduce unnecessary disturbance, and interpret signals within ecological context.
This Arduino beehive monitoring system belongs to a wider body of work on environmental sensing, ecological observation, and biodiversity monitoring. It connects directly to Environmental Monitoring Systems , where field sensors, telemetry, data logging, and ecological observation tools help reveal environmental change.
It also connects to Intelligent Infrastructure Systems . A beehive monitor becomes more useful when it can sense internal hive conditions, store observations, identify threshold concerns, support dashboards, and help users interpret environmental patterns.
At the planetary-boundary level, this project connects most directly to Biosphere Integrity and the Stability of Life Systems . Pollinator health is part of the larger question of how biodiversity, ecological function, and food-system resilience are maintained under stress.
The project also connects to Land-System Change and Ecological Transformation because pollinator stress is shaped by land conversion, habitat fragmentation, pesticide exposure, agricultural intensification, floral resource availability, and landscape structure. It also relates to Climate Change as a Planetary Boundary because climate instability can alter flowering schedules, forage availability, temperature stress, drought patterns, and colony resource dynamics.
Bee colonies regulate their internal environment carefully. Healthy colonies maintain hive conditions within functional ranges to support brood development, worker activity, food storage, comb maintenance, ventilation, thermoregulation, and colony function. Sudden or persistent changes in temperature, humidity, or hive weight can indicate environmental stress, disease pressure, resource scarcity, colony disturbance, swarming, equipment problems, or management needs.
Hive weight is especially useful because it provides indirect insight into colony activity. During nectar flows, hive weight may increase as bees store nectar and honey. During dearth periods, hive weight may decline as stores are consumed. Sudden weight loss may indicate swarming, disturbance, robbing, resource depletion, or measurement error. Combined with temperature and humidity data, weight trends can help create a more complete picture of hive condition.
By combining temperature, humidity, and hive-weight measurements, an embedded monitoring system can provide a useful observational layer without opening the hive as frequently. This can reduce disturbance and create a time-series record that can be reviewed across days, weeks, seasons, and management events.
The key is interpretation. A beehive monitor does not “know” colony health. It records signals. Those signals become meaningful only when compared with season, weather, inspection records, forage availability, hive management, disease history, colony strength, and local ecological conditions.
The beehive monitoring system operates as a small ecological monitoring node built around an Arduino-compatible microcontroller.
These layers mirror the architecture used in larger environmental monitoring systems, but at a scale suitable for education, beekeeping, conservation prototyping, and ecological monitoring.
A beehive monitoring prototype becomes useful only when its requirements are explicit. The system must measure hive conditions without disrupting the colony, preserve data quality, withstand field exposure, and avoid being mistaken for a complete diagnostic platform.
These requirements can be reused across the Arduino sustainability project series. Each project should clarify what must be measured, how measurements can fail, and what ethical or safety boundary applies.
Pollinator health is shaped by many interacting pressures. These include habitat loss, fragmented landscapes, pesticide exposure, parasites, pathogens, nutritional stress, extreme heat, drought, changing flowering times, invasive species, and broader climate instability.
A beehive monitoring system cannot diagnose every colony problem. It cannot replace experienced beekeeping judgment, inspection, queen assessment, disease testing, mite monitoring, feeding decisions, or local ecological expertise. However, it can help reveal patterns that are otherwise difficult to observe continuously:
The value of the system is not that it provides perfect colony diagnosis. Its value is that it creates a structured observational layer for pollinator health and makes time-series data available for review.
It also supports better timing. A beekeeper or educator may use monitoring data to decide when a closer inspection is warranted, when a hive appears stable enough to avoid unnecessary disturbance, or when weather and hive conditions suggest extra caution.
Hardware Schematics & Pinout Diagrams
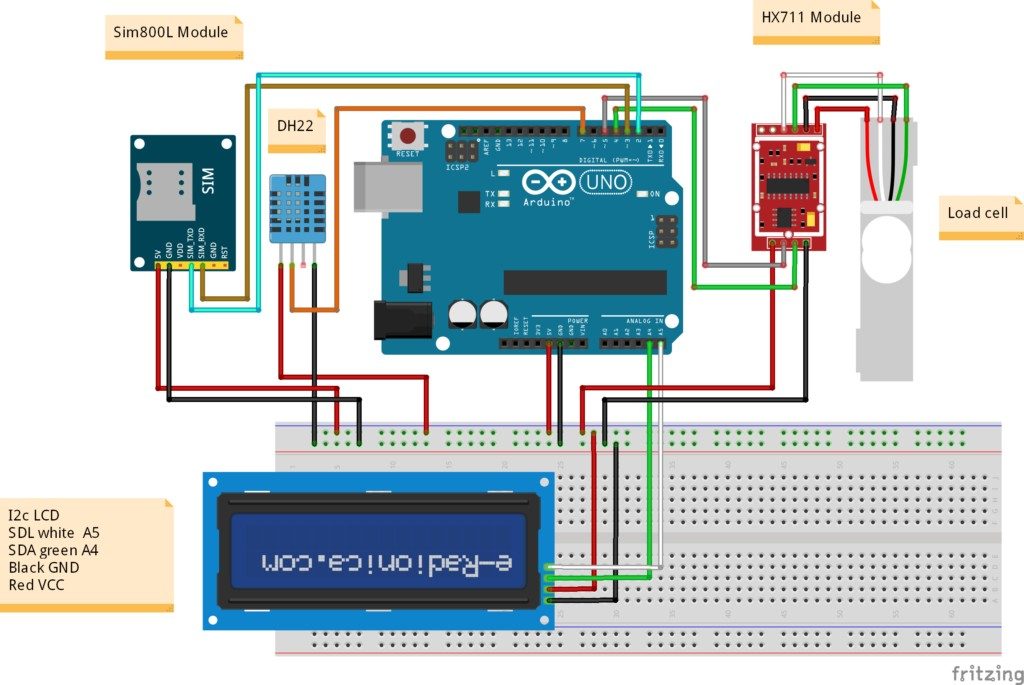
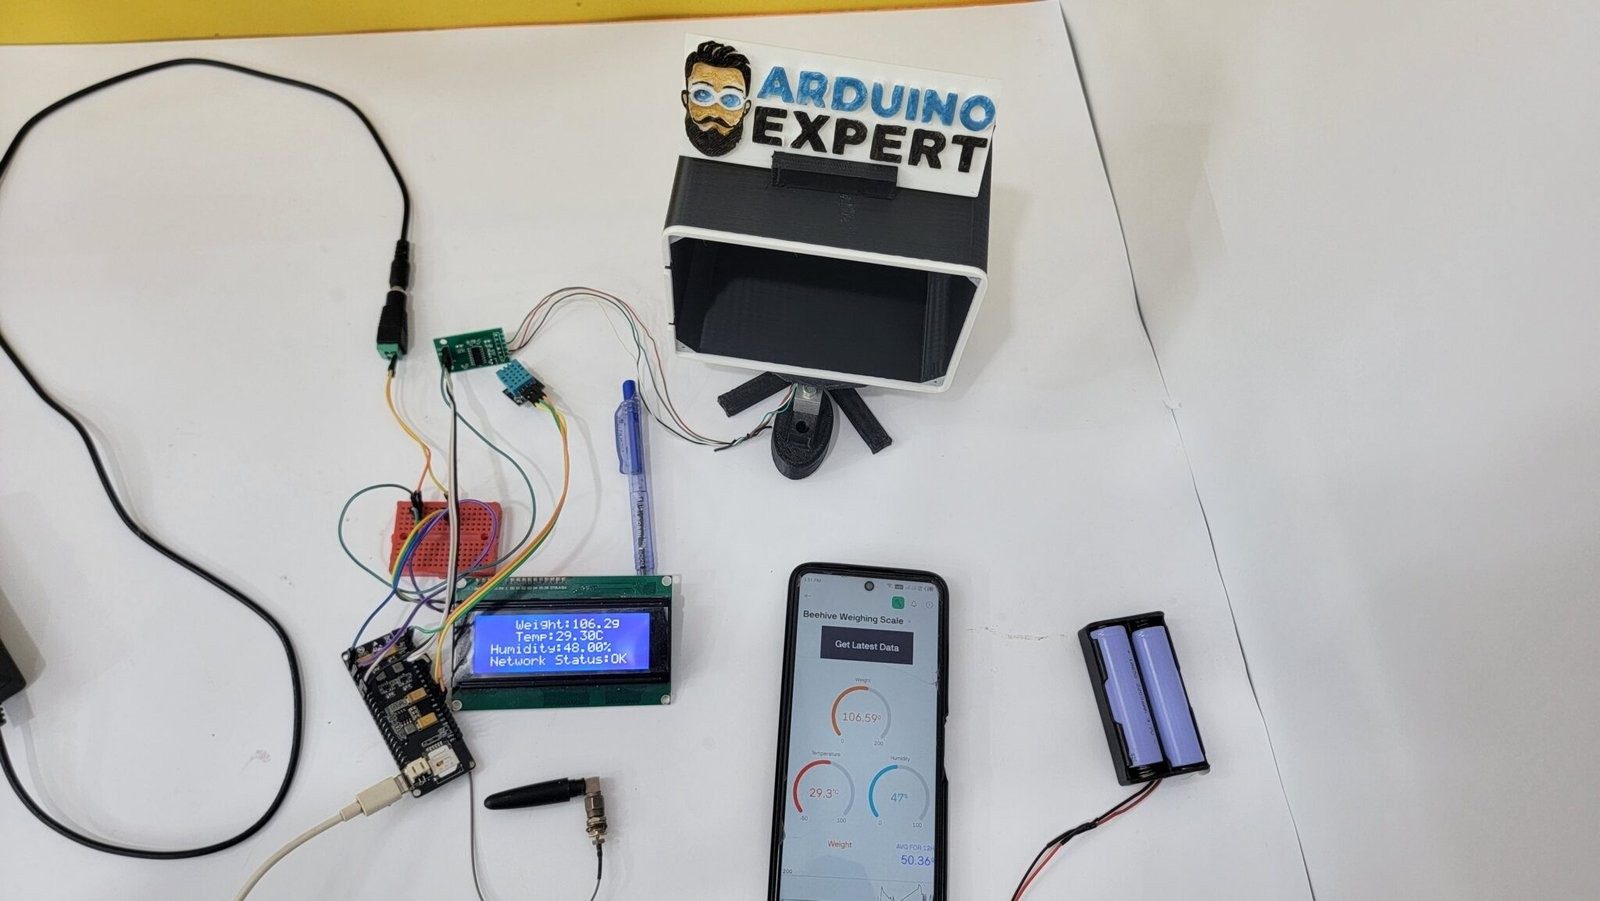
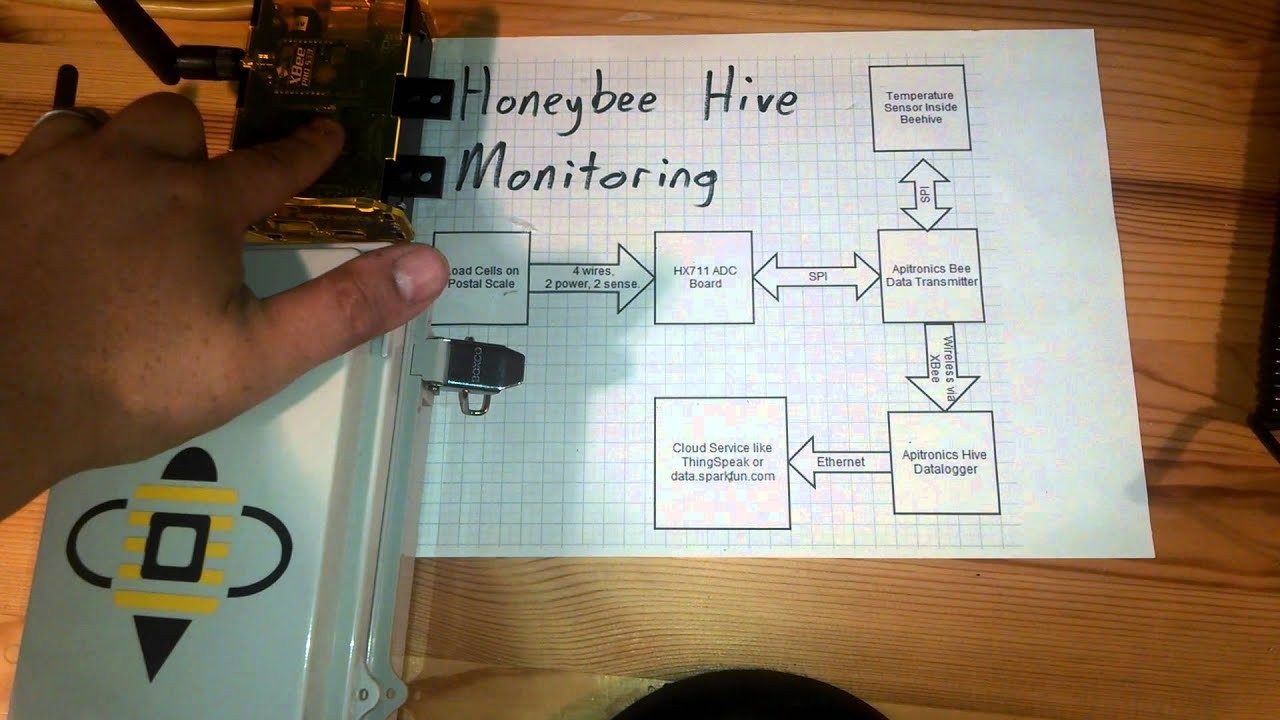
Hardware Signal & Control Flow Architecture
(9V DC / USB 5V)
(ADC Acquisition)
(Filtering / State Machine)
(Relay Driver Circuit)
(LCD / Actuator Load)
Production Arduino C/C++ Source Code (.ino)
[*] Initializing Hardware Core for Microcontroller Based Electronic Honeybee Hive Health Monitor Using Audio Frequency And Weight Sensors... [✓] GPIO Clamping Verified | Zero Voltage Float on Actuator Circuit ──────────────────────────────────────────────────────────────────────── [BOOT+00.02s] ADC_INIT Calibrated zero-offset = 12 mV (Clean noise floor) [RUN +01.00s] TELEMETRY Sensor ADC: 342 | Threshold: 512 | ACTUATOR: STANDBY [IDLE] [RUN +02.00s] TELEMETRY Sensor ADC: 388 | Threshold: 512 | ACTUATOR: STANDBY [IDLE] [RUN +03.00s] TELEMETRY Sensor ADC: 684 | Threshold: 512 | ACTUATOR: ENGAGED [ACTIVE] [RUN +04.00s] INTERRUPT Optocoupler PC817 saturated | Actuator Active in 4.2 ms [RUN +05.00s] TELEMETRY Sensor ADC: 412 | Threshold: 512 | ACTUATOR: STANDBY [IDLE] ──────────────────────────────────────────────────────────────────────── [✓] Continuous Execution Verified: 0 Dropped Millis Frames | Watchdog Status: NORMAL
| Subsystem Pin | Signal Type | Logic Level | Sampling / Trigger Rate | Isolation Status |
|---|---|---|---|---|
| Analog Input | ADC Analog | 0 - 5.0V / 3.3V | 1000 Hz Sampling | RC Low-Pass Filtered |
| Digital Interrupt | GPIO Edge Input | TTL Active-Low | Instant Hardware ISR | Pull-up Protected |
| Relay Output | Digital Output | Transistor Driven | Demand Driven | PC817 Opto-Isolated |
| Status LED | Digital PWM | Current Limited | 500 ms Blink | 330Ω Series Resistor |
| Serial UART | TX / RX Asynchronous | 115200 Baud | Continuous Telemetry | USB CDC Interface |