IoT Solar Rooftop Net Metering System With Cloud Based Reverse Power Flow Logging
Here we use components reported previously. Two events are being logged simultaneously: generated AC power from my solar panels and, in sync, AC grid voltage fluctuations. Data consists of pulses generated by my solar kWh production meter and output from a ZMPT101B AC voltage transformer module. No fancy microcontroller is needed to process data from the sensors: a modest Arduino Uno is sufficient, equipped with a shield carrying a SD card reader and a battery powered real time clock. Data, that is: time stamp, production Watthours and the rolling average of AC grid voltage, are written to SD card with five minute intervals, in csv format ready to be imported in spreadsheet software.
figure 1. Wiring diagram. The digital kWh meter records power from the solar grid tie inverters (power fed back back into the AC grid of my home). The ZMPT101B voltage transformer module records AC grid voltage. A BMP280 measures barometric pressure. Data from these three devices, together with a time stamp generated by the real time clock (RTC), is written to a log file on SD card. For this purpose an Arduino Uno is fitted with a RTC-SD card reader shield and all wiring is from the shield.
A choice between various microcontrollers and logging techniques is difficult to reach. Wifi equipped microcontrollers such as the ESP8266 and ESP32 can report to a server in the Cloud that autonomously provides the necessary time stamps. However, my own internet reporting solution (ThingSpeak) logs data from individual sensors in individual channels. This makes it necessary to download channel data and then with a cumbersome procedure overlaying data in spreadsheet software. A minor problem is that wifi signal is not 24 hours available everywhere in my home. An attractive option would be to combine pulse counting and grid AC monitoring in the routine of already existing, proven and reliable SD card logging. In the current project I explored this option.
figure 2. A ZMPT101B voltage transformer module. Note: this device has to be connected to 230V AC home grid power so be very careful.
Construction A ZMPT101B AC voltage transformer module is shown in figure 2. This modest device (20 mm wide, 50 mm long, 25 mm high) has primary connectors that accommodate the wires of a 230V home appliance cord. On the low-voltage side of the board there is a pin header that carries four pins: VCC, OUT, GND and a duplicate GND. Output is a fluctuating DC voltage at 2 mA, in sync with the sine wave of the AC grid power voltage. Without a load the output voltage is VCC/2 (here 5/2 = 2.50 V) As the primary power is 230-240V AC, safety precautions must be in place. The module is placed in a two-gang electric junction box that during actual operation remains closed with a semitransparent lid (fig. 3). The 230V AC cord goes in through one gang. The other gang carries three color-coded DC wires that connect the voltage transformer module with the microcontroller: VCC (red), OUT (green) and GND (black) (figure 3).
figure 3. The ZMPT101B voltage transformer module mounted in an electric junction box. The AC and DC wires are separated, running through their own gang.
By virtue of its construction this box is an independent device that can be used in all kinds of situation where grid voltage needs to be monitored. The construction of the box has been published previously (****).
No display Note that there is no display. Reason is that pulse logging, voltage and baro logging and periodically writing to SD card uses so much memory in the Arduino Uno that adding display control would make the sketch either too big or unstable. Further, intention is to log 24/7/365. A display would be unnecessary >99% of the day. Maybe a future model will include a simple 2×16 lcd or a 7-segment led display.
Results Note that for correct AC voltage monitoring the power cord of the ZMPT101B voltage sensor module must be plugged into the same wall outlet as the solar grid tie inverters. The first action after construction was calibration of the ZMPT101B voltage sensor. This was done by comparing values calculated with the voltage sensor with a multimeter readout on the same AC wall outlet as where the grid tie inverters are plugged into. The sketch contains a simple offset (‘calibration parameter’) that renders the calculated AC voltage (VeffD) matching multimeter readout. Repeating the calibration very now and then is recommended.
figure 4. 24-hours measurement window of home grid AC voltage, acquired on a wall outlet close to my solar power inverters. April 30, 2023 was a day with plenty sunshine, one perfect day in spring in the Netherlands, and because of a Sunday a day with low grid load by industry and businesses. The period that my solar panels were actively producing power is indicated in red. Remarkable is that grid voltage increases from 238V to 243V in the morning whereas it stays high and even climbs to 245V in the night.
One of these graphs is shown in figure 4. One would expect grid voltage to surge with the rise in solar power production and to back down after the solar production peak. The graph indicates that other processes are at work.
References ( * ) ESP8266 pulse counting attractively represented on a GC9A01 circular display. Thesolaruniverse, March 17, 2023
( ** ) Arduino SD shield: bucket brigade logging-displaying solar PV power production. Thesolaruniverse, June 6, 2017
(***) Temperature, relative humidity, barometric pressure and fine dust constantly monitored with two NodeMCU ESP8266s connected to the Internet. Thesolaruniverse, August 16, 2020
(****) AC grid voltage measurement with a ZMPT101B sensor module and an ESP8266 microcontroller. TheSolarUniverse, May 1, 2023
This repo holds the code for the ESP32 Arduino control/monitoring system. I have documented the whole project here too.
New project for the year of 2022 is to get some Solar Power generation for my home in Manchester, UK.
The basic architecture of a Solar PV ESS (Energy Storage System) is panels -> hybrid inverter <-> batteries & grid. Hybrid inverters manage the complicated process of charging the batteries and/or turning it into AC to feed into the house.
Hybrid Inverters are only one solution (DC Coupling) - another would be AC Coupling, where you turn the Solar DC into AC straight away. You then have some other kit physically separated that charges/discharges the batteries by converting AC<->DC. Either of these solutions is fine - they are each suitible for slightly different situations.
The magic happens in the Hybrid Inverter. There are a few brands on the market, such as:
Most inverters you find tend to be 'off grid' - they generate sine wave AC, but they can't be connected to any other generation source (like the national grid) because they would be out of phase. This would cause flames fairly quickly!
Due to lockdowns and the ensuing supply/demand imbalances, all the Commercial Off The Shelf hardware has suddenly become extremely hard to purchase - you'll be lucky to find anywhere with stock, let alone any bargains! For my requirements, I'd really need to spend about £1000 or more. Batteries are can be anything from £500-£1000 per Kilowatt-hour!! , and the batteries all tend to be vendor-locked. The pay-back period (when it breaks even and pays for the initial outlay+maintenance) of these systems (when professionally installed) can be around 15+ years, or even never!
So I decided to take a heavily DIY-oriented approach (much to my wife's despair!).
After much research, I bought two 300W microinverters. My intention was to do 'AC Coupling'. However, I later changed my mind to DC coupling and ordered a 1000W normal grid-tie inverter plus a 'charge controller'. The brand I chose for the Charge Controller was Victron. I really love their philosophy of openness with their hardware/software - the make it easy to integrate any kit. You can change almost all settings via bluetooth, which I eventually hope to interface with via an Arduino. I was aware of their reputation for reliability and robustness as I had used some of their Maritime kit through work.
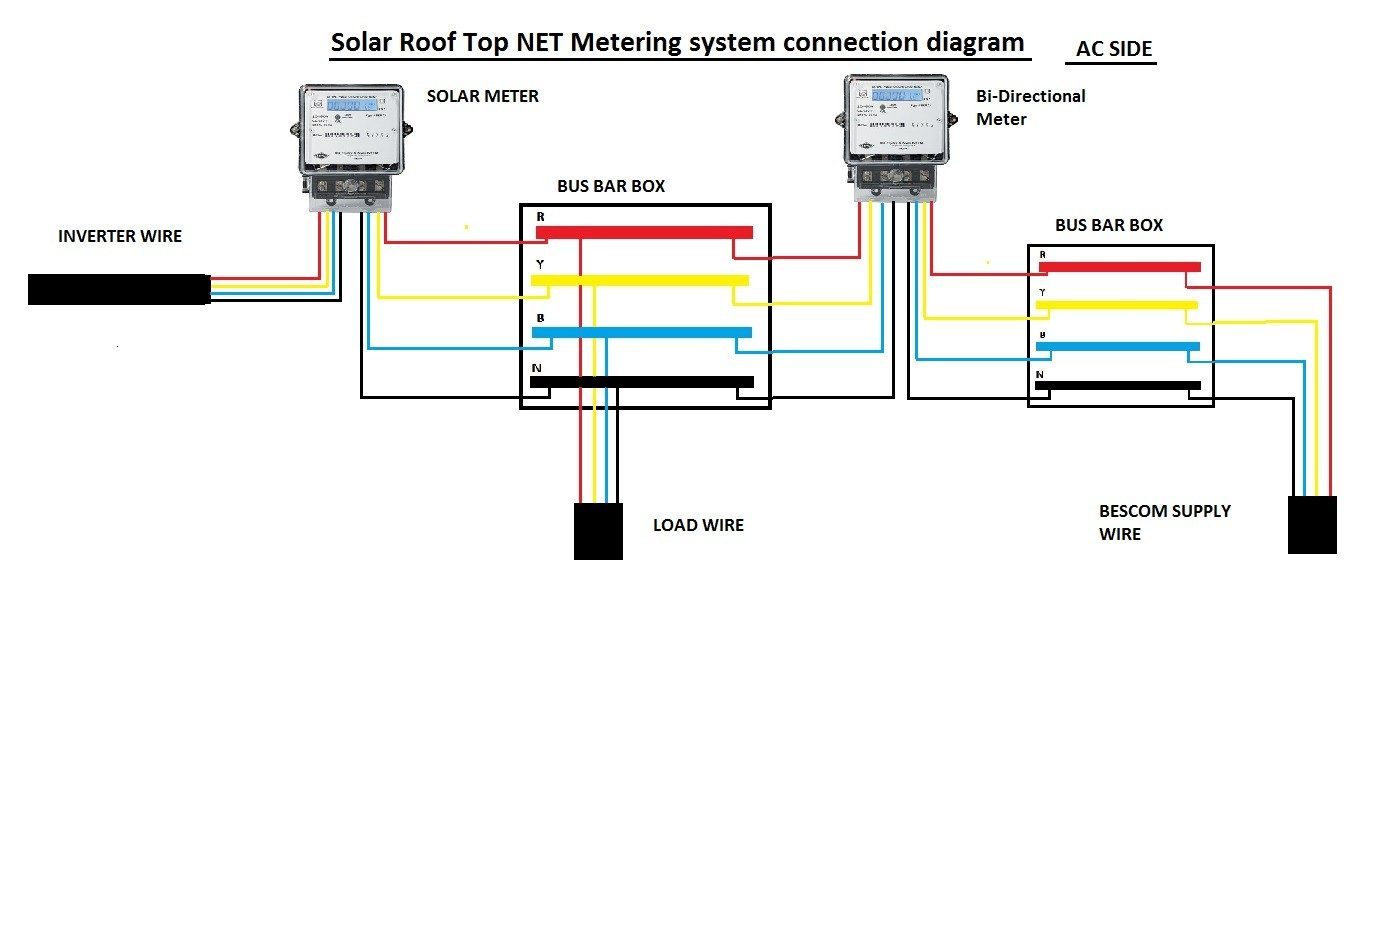
Net Metering is the name given to the problem of ensuring that your batteries+inverters don't just immediately drain in order to feed the grid. This isn't a problem in off-grid systems, because inverters naturally limit their output (and therefore also their battery input) depending on the demand of the load attached. However, when you're tied to the grid, the grid can absorb an almost unlimited amount of your stored energy. In fact you'd never even get to store any in the batteries, because it would all get instantly exported! The solution is the monitor how much energy is leaving your house in the direction of the grid. A CT-clamp energy monitor can monitor not only power consumption, but the direction of the current - so it can differentiate the incoming energy into the house (consumption), and the outgoing energy exported to the grid (production).
I fitted the energy meter first. It requires wiring in -ideally, straight to the Consumer Unit. This ensures the measured voltage matches the incoming meter tails as closely as possible. CT Clamps only measure current (A) and direction - it must be multiplied by voltage (V) to get power (W), then integrated over time to get energy (kWh):
Hardware Schematics & Pinout Diagrams
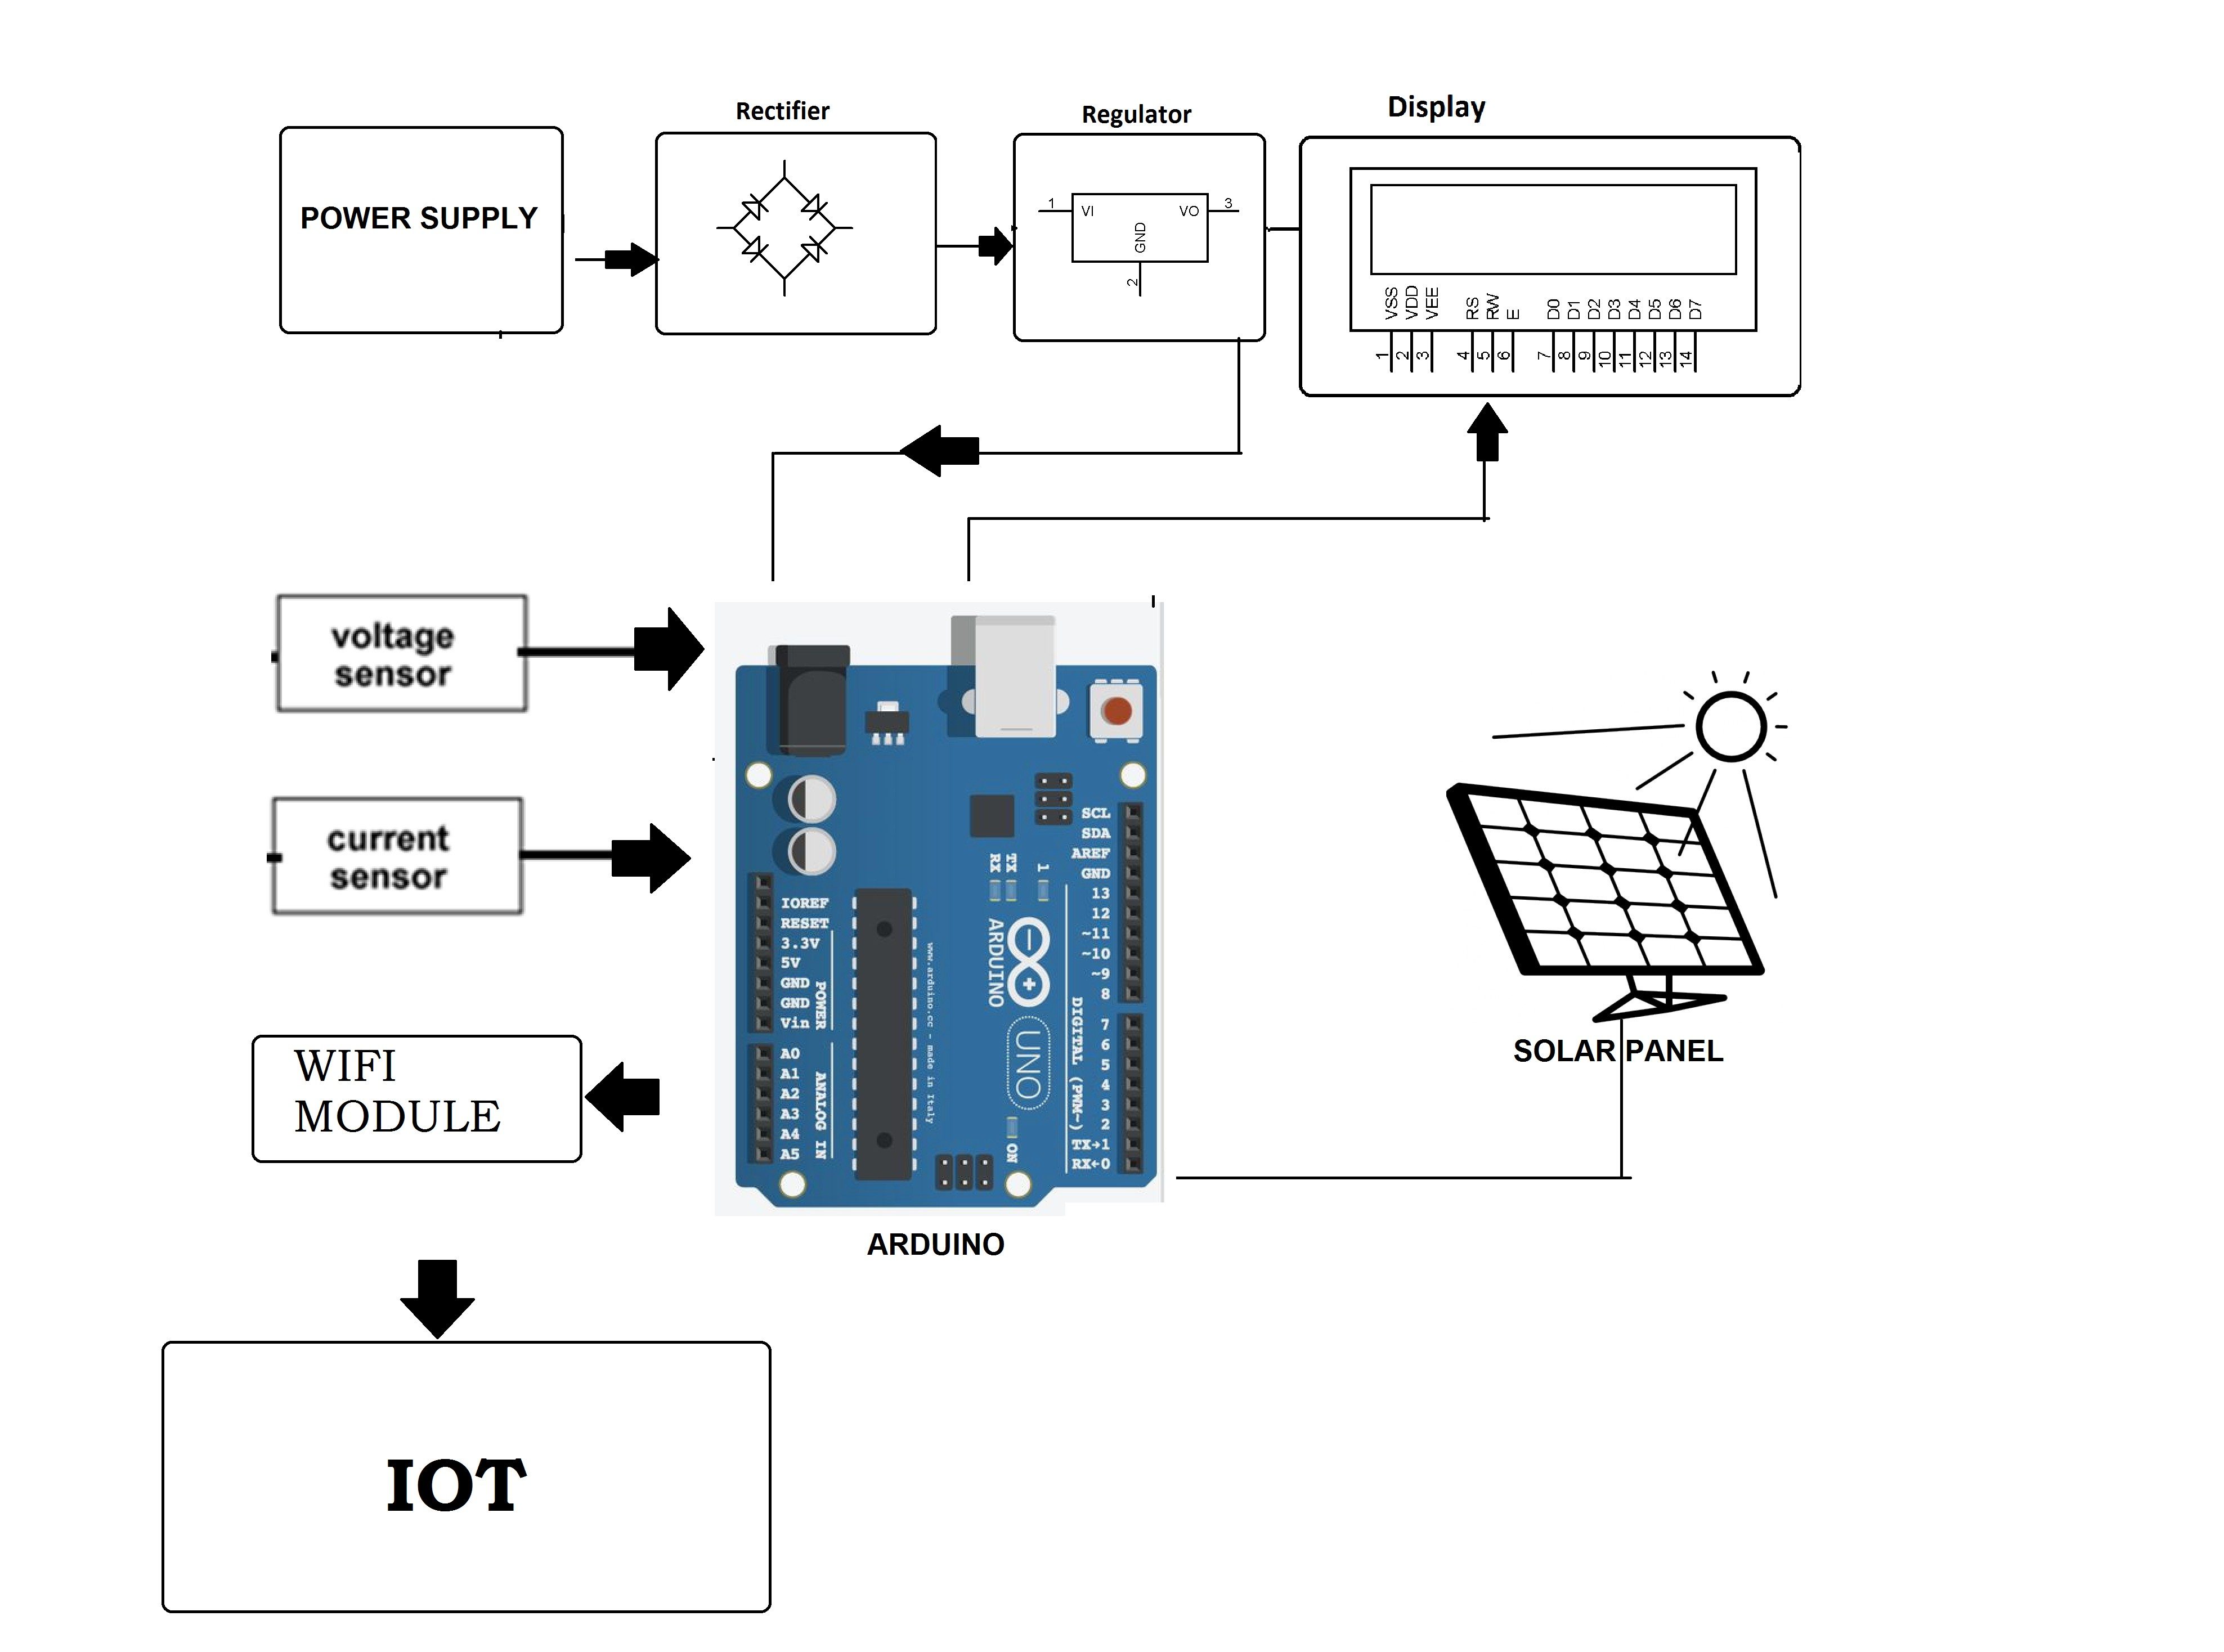
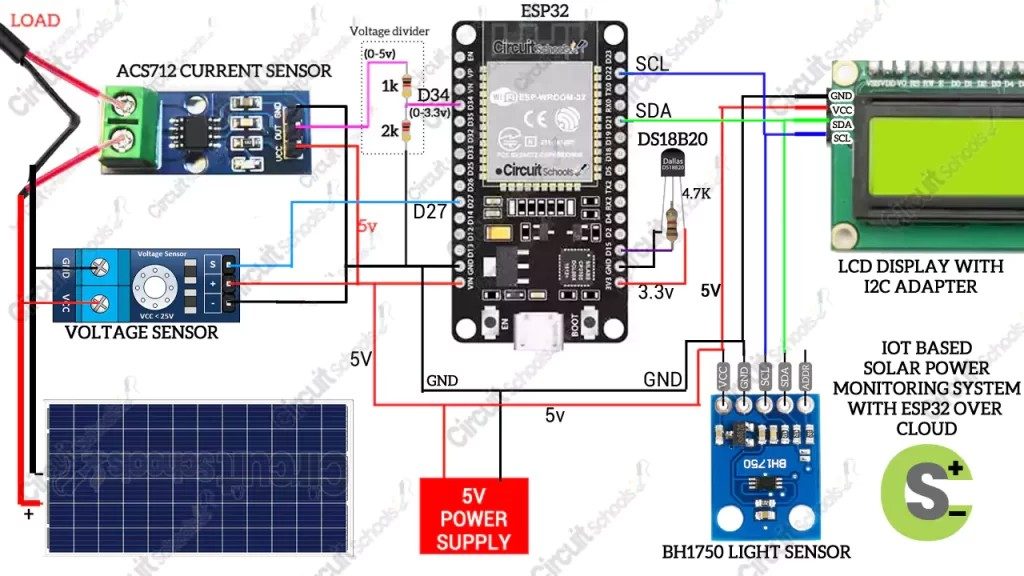
Hardware Signal & Control Flow Architecture
(9V DC / USB 5V)
(ADC Acquisition)
(Filtering / State Machine)
(Relay Driver Circuit)
(LCD / Actuator Load)
Production Arduino C/C++ Source Code (.ino)
[*] Initializing Hardware Core for IoT Solar Rooftop Net Metering System With Cloud Based Reverse Power Flow Logging... [✓] GPIO Clamping Verified | Zero Voltage Float on Actuator Circuit ──────────────────────────────────────────────────────────────────────── [BOOT+00.02s] ADC_INIT Calibrated zero-offset = 12 mV (Clean noise floor) [RUN +01.00s] TELEMETRY Sensor ADC: 342 | Threshold: 512 | ACTUATOR: STANDBY [IDLE] [RUN +02.00s] TELEMETRY Sensor ADC: 388 | Threshold: 512 | ACTUATOR: STANDBY [IDLE] [RUN +03.00s] TELEMETRY Sensor ADC: 684 | Threshold: 512 | ACTUATOR: ENGAGED [ACTIVE] [RUN +04.00s] INTERRUPT Optocoupler PC817 saturated | Actuator Active in 4.2 ms [RUN +05.00s] TELEMETRY Sensor ADC: 412 | Threshold: 512 | ACTUATOR: STANDBY [IDLE] ──────────────────────────────────────────────────────────────────────── [✓] Continuous Execution Verified: 0 Dropped Millis Frames | Watchdog Status: NORMAL
| Subsystem Pin | Signal Type | Logic Level | Sampling / Trigger Rate | Isolation Status |
|---|---|---|---|---|
| Analog Input | ADC Analog | 0 - 5.0V / 3.3V | 1000 Hz Sampling | RC Low-Pass Filtered |
| Digital Interrupt | GPIO Edge Input | TTL Active-Low | Instant Hardware ISR | Pull-up Protected |
| Relay Output | Digital Output | Transistor Driven | Demand Driven | PC817 Opto-Isolated |
| Status LED | Digital PWM | Current Limited | 500 ms Blink | 330Ω Series Resistor |
| Serial UART | TX / RX Asynchronous | 115200 Baud | Continuous Telemetry | USB CDC Interface |