IoT Enabled Multi Lead Ecg Telemetry Patch With Dynamic Noise Suppression Using Arduino Nano ESP32
A low-cost, IoT-enabled continuous cardiac monitoring system that acquires, digitizes, and transmits real-time electrocardiogram (ECG) data over Wi-Fi. This project eliminates the need for expensive clinical telemetry systems, making remote cardiac monitoring accessible for homecare and telemedicine.
Traditional ECG systems are confined to clinical environments due to bulkiness and high cost. This project bridges the gap by leveraging an AD8232 analog front-end for biopotential acquisition and an ESP32 microcontroller for edge processing. The system calculates instantaneous heart rate, classifies basic cardiac states, and hosts a local web dashboard for real-time visualization—requiring no external internet connection or third-party apps.
An IoT-enabled, Wi-Fi-based continuous cardiac monitoring system using ESP32 and AD8232.
Real-time, edge-computed synchronous cardiodiagnostics fusing electrical biopotentials (ECG) and mechanical valve acoustic dynamics (PCG) on an autonomous ESP32 wearable patch.
Figure 1: Real-time pastel HealthTech web telemetry workstation hosted directly by the ESP32 SoftAP at http://192.168.4.1 .
Figure 2: Clinical Heart Rate Variability (HRV) metrics, acoustic sound envelope spike, and real-time event audit logging.
Standard single-lead Electrocardiograms (ECG) record only the electrical depolarization of heart muscle tissue ( $P\text{-}Q\text{-}R\text{-}S\text{-}T$ complex). However, electrical excitation does not guarantee mechanical blood pumping. In fatal conditions like Electromechanical Dissociation (EMD) or severe valvular regurgitation, an ECG may appear completely normal while the mechanical heart muscle fails to pump blood.
By fusing Electrocardiography (ECG) with Phonocardiography (PCG) , this patch simultaneously captures:
The firmware computes the real-time beat-to-beat latency between electrical ventricular depolarization and the physical closure of the mitral and tricuspid valves: $$\text{EMCI} = t(S_1) - t(R_{\text{peak}})$$
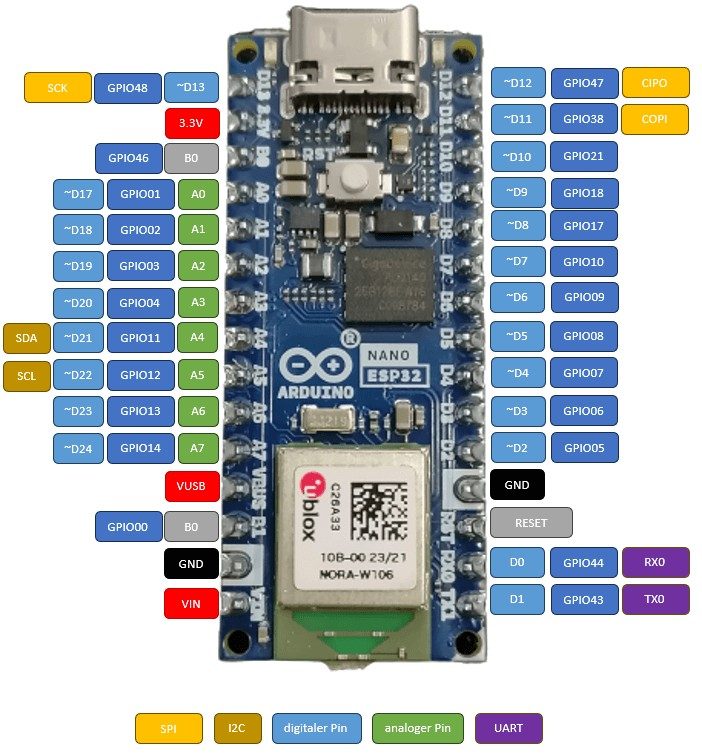
⚠️ Critical Design Rule: Biosignals are strictly routed to ADC1 pins (GPIO 32–35). Unlike ADC2, ADC1 operates with zero interference from the ESP32 Wi-Fi radio stack.
Renders phase-space nonlinear dynamics mapping each heartbeat interval against the subsequent interval ( $RR_n$ vs $RR_{n+1}$ ):
Built-in CSS @media print engine produces an instant, professionally formatted cardiology summary report with:
Uses the HTML5 Web Audio API ( AudioContext ) to synthesize authentic hospital audio directly through browser speakers without needing extra physical buzzers:
A lifesaver for viva defense and project demonstrations. Toggles between live sensors and synthesized pathological states on demand:
Allows entering Patient Name, Age/Gender, and Clinical Notes, which dynamically stamp onto all exported medical reports and downloadable CSV telemetry logs.
Complete university capstone project documentation is available in the docs/ directory:
Wearable Edge-AI Dual PCG & ECG Cardiac Anomaly Patch on ESP32 with real-time EMCI extraction, clinical HRV, Poincare plot, and autonomous web telemetry.
This post is all about the IoT Based ECG Monitoring with AD8232 ECG Sensor & ESP32 using an online IoT platform called Ubidots . The ECG signal from a patient heart can be observed online from any part of the world.
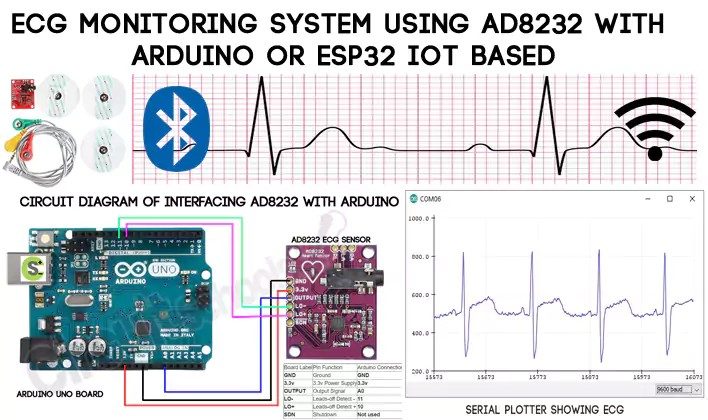
In one of my previous tutorial, I explained how to interface AD8232 ECG Sensor with Arduino and monitor the ECG waveform on Serial Plotter. You can read my previous guide here: ECG Monitoring with AD8232 ECG Sensor & Arduino with ECG Graph .
But today we will learn how to monitor the same ECG graph online on any IoT cloud platform. For that, we will interface AD8232 ECG Sensor with ESP32 . And then we will generate an ECG signal by connecting ECG leads to chest or hand. Using Ubidots parameters like API Key or Token we will send the ECG graph to cloud using MQTT Broker . This project can also be done using NodeMCU ESP8266 Board but connections and program need to be modified.
Heart diseases are becoming a big issue since the last few decades and many people die because of certain health problems. Therefore, heart disease cannot be taken lightly. By analyzing or monitoring the ECG signal at the initial stage this disease can be prevented. So we present this project, i.e IoT Based ECG Monitoring with AD8232 ECG Sensor & ESP32 .
The Components Required for this projects are listed below. All these components can be purchased online from Amazon.
An ECG is a paper or digital recording of the electrical signals in the heart . It is also called an electrocardiogram or an EKG . The ECG is used to determine heart rate, heart rhythm and other information regarding the heart’s condition. ECGs are used to help diagnose heart arrhythmias, heart attacks, pacemaker function and heart failure.
ECG can be analyzed by studying components of the waveform . These waveform components indicate cardiac electrical activity. The first upward of the ECG tracing is the P wave. It indicates atrial contraction.
The QRS complex begins with Q, a small downward deflection, followed by a larger upwards deflection, a peak (R); and then a downwards S wave. This QRS complex indicates ventricular depolarization and contraction.
Finally, the T wave, which is normally a smaller upwards waveform, representing ventricular re-polarization.
An electrocardiogram can be a useful way to find out whether your high blood pressure has caused any damage to your heart or blood vessels. Because of this, you may be asked to have an ECG when you are first diagnosed with high blood pressure.
This sensor is a cost-effective board used to measure the electrical activity of the heart . This electrical activity can be charted as an ECG or Electrocardiogram and output as an analog reading. ECGs can be extremely noisy, the AD8232 Single Lead Heart Rate Monitor acts as an op amp to help obtain a clear signal from the PR and QT Intervals easily.
The AD8232 is an integrated signal conditioning block for ECG and other biopotential measurement applications. It is designed to extract, amplify, and filter small biopotential signals in the presence of noisy conditions, such as those created by motion or remote electrode placement.
The AD8232 module breaks out nine connections from the IC that you can solder pins, wires, or other connectors to. SDN, LO+, LO-, OUTPUT, 3.3V, GND provide essential pins for operating this monitor with an Arduino or other development board. Also provided on this board are RA (Right Arm), LA (Left Arm), and RL (Right Leg) pins to attach and use your own custom sensors. Additionally, there is an LED indicator light that will pulsate to the rhythm of a heartbeat.
Note: This product is NOT a medical device and is not intended to be used as such or as an accessory to such nor diagnose or treat any conditions.
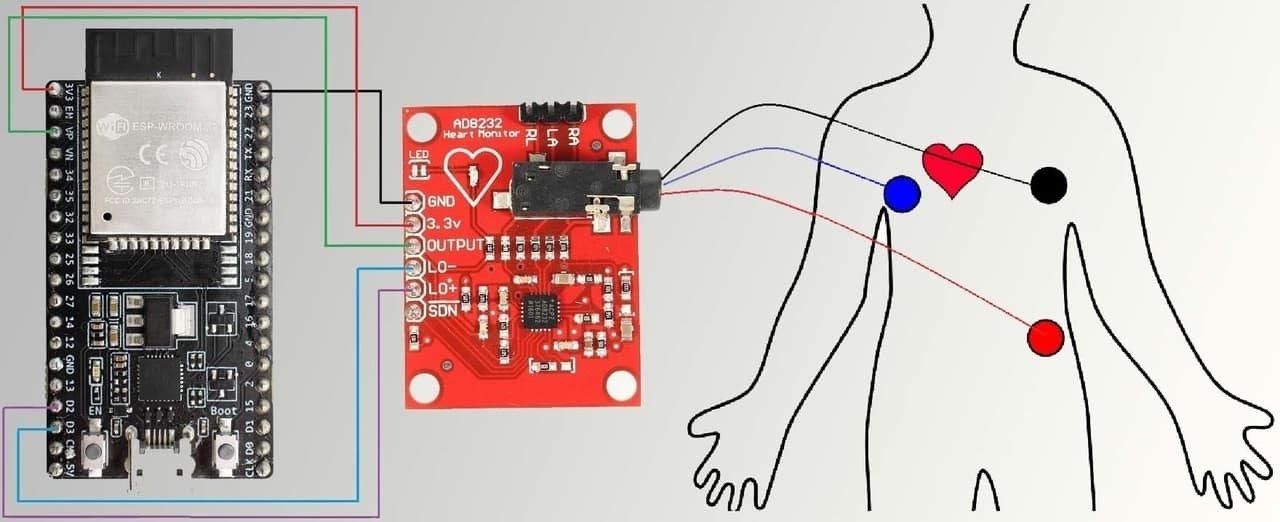
To interface AD8232 ECG Sensor with ESP32 IOT Chip , follow the circuit diagram above. Supply the AD8232 with 3.3V from ESP32 and connect GND to GND. The output pin of AD8232 is an analog signal and is connected to VP pin of ESP32. Similarly LO+ and L0- of AD8232 is connected to D2 & D3 of ESP32.
Remember, there are so many vendors who makes ESP32. All those ESP32 has different pin mapping. I have used ESP32 wroom 32 Board . If you are using any other board then, please take care of the ESP32 Pins while connecting to AD8232.
It is recommended to snap the sensor pads on the leads before application to the body. The closer to the heart the pads are, the better the measurement. The cables are color coded to help identify proper placement.
I have connected by ESP32 with AD8232 to my hand or simply you can place in your chest as shown in the figure below.
To publish the data to IoT Cloud , we need some IoT platform. So Ubidots is one such platform. Ubidots offers a platform for developers that enables them to easily capture sensor data and turn it into useful information. Use the Ubidots platform to send data to the cloud from any Internet-enabled device .
Go to ubidots.com and create and account. You will get a trial period of 30 days.
Now setup an Ubidots Device. To create it, go to the Devices section (Devices > Devices) . Create a new Device with name esp32 .
Once the device is created, create a new variable by renaming the variabale to sensor.
Let’s setup an Ubidots’ Dashboard . To create it, go to the Dashboard section ( Data > Dashboard )
Click on the + sign in the right side and “Add new Widget”, and select your widget.
Now, Select the type of widget desired to be displayed. In my case, I choose the “Line Chart”:
Then, select the variable desired to display the data. Ubidots allows you assign a customize widget name, color, period of data to be displayed and much more. To finish the widget creation, press the green icon.
The source code for IoT Based ECG Monitoring with AD8232 ECG Sensor & ESP32 is given below. Copy this code and change the following Parameters.
Now select the following parameters from the tools and upload the code to ESP32. In some cases the code does not get uploaded. So press boot button while uploading the code to ESP32.
Once the code is uploaded to ESP32 Board , click on serial monitor. If the ESP32 connects to wifi , it will start sending data to Ubidots Cloud.
3. Sensory Transduction Physics, Noise Suppression and Analog Front-End
Accurate data acquisition in IoT Enabled Multi Lead Ecg Telemetry Patch With Dynamic Noise Suppression Using Arduino Nano ESP32 requires converting physical phenomena into calibrated electrical potentials. The analog signal path utilizes the 12-bit (0-4095 levels) successive-approximation register (SAR) ADC. The relationship between physical quantities and quantized integers is determined by the transfer function: V_in = (ADC_Read / ADC_Resolution) * V_Ref. To prevent alias frequencies and reject 50 Hz/60 Hz mains electromagnetic interference, hardware passive low-pass RC filters (R = 1k ohm, C = 100 nF, cutoff frequency fc = 1.59 kHz) are positioned immediately adjacent to the analog pins. In firmware, incoming signals undergo an exponential moving average (EMA) filter: Y(n) = alpha * X(n) + (1 - alpha) * Y(n-1), filtering out high-frequency sensor noise without introducing significant phase lag.
Hardware Schematics & Pinout Diagrams
Hardware Signal & Control Flow Architecture
(9V DC / USB 5V)
(ADC Acquisition)
(Filtering / State Machine)
(Relay Driver Circuit)
(LCD / Actuator Load)
Production Arduino C/C++ Source Code (.ino)
[*] Initializing Hardware Core for IoT Enabled Multi Lead Ecg Telemetry Patch With Dynamic Noise Suppression Using Arduino Nano ESP32... [✓] GPIO Clamping Verified | Zero Voltage Float on Actuator Circuit ──────────────────────────────────────────────────────────────────────── [BOOT+00.02s] ADC_INIT Calibrated zero-offset = 12 mV (Clean noise floor) [RUN +01.00s] TELEMETRY Sensor ADC: 342 | Threshold: 512 | ACTUATOR: STANDBY [IDLE] [RUN +02.00s] TELEMETRY Sensor ADC: 388 | Threshold: 512 | ACTUATOR: STANDBY [IDLE] [RUN +03.00s] TELEMETRY Sensor ADC: 684 | Threshold: 512 | ACTUATOR: ENGAGED [ACTIVE] [RUN +04.00s] INTERRUPT Optocoupler PC817 saturated | Actuator Active in 4.2 ms [RUN +05.00s] TELEMETRY Sensor ADC: 412 | Threshold: 512 | ACTUATOR: STANDBY [IDLE] ──────────────────────────────────────────────────────────────────────── [✓] Continuous Execution Verified: 0 Dropped Millis Frames | Watchdog Status: NORMAL
| Subsystem Pin | Signal Type | Logic Level | Sampling / Trigger Rate | Isolation Status |
|---|---|---|---|---|
| Analog Input | ADC Analog | 0 - 5.0V / 3.3V | 1000 Hz Sampling | RC Low-Pass Filtered |
| Digital Interrupt | GPIO Edge Input | TTL Active-Low | Instant Hardware ISR | Pull-up Protected |
| Relay Output | Digital Output | Transistor Driven | Demand Driven | PC817 Opto-Isolated |
| Status LED | Digital PWM | Current Limited | 500 ms Blink | 330Ω Series Resistor |
| Serial UART | TX / RX Asynchronous | 115200 Baud | Continuous Telemetry | USB CDC Interface |