High Voltage Bushing Dissipation Factor Tan Delta Continuous Monitoring Node Via Arduino
Capacitance testing, tan delta measurement, and power factor analysis are vital diagnostic techniques for assessing the insulation health of high-voltage equipment, including capacitor banks and capacitive bushings. These procedures detect early signs of deterioration, moisture ingress, or partial discharge, ensuring that power systems operate reliably and efficiently. As global energy infrastructure ages, utilities, manufacturers, and maintenance engineers are prioritizing ongoing monitoring of dielectric properties to prevent costly failures and unplanned outages.
Capacitance represents a component’s ability to store electrical energy between two conductive surfaces separated by insulation (dielectric). In capacitor banks, capacitance values should remain stable over time. A sudden change indicates potential insulation faults, contamination, or physical damage. Monitoring capacitance helps engineers identify unbalanced loads, detect failing elements within capacitor units, and maintain reactive power optimization in substations. In bushings, variations may point to degradation of internal insulation layers or gas pressure changes in oil-paper or SF6 designs.
Tan delta, also known as the dissipation factor, measures dielectric losses in insulation systems. A higher tan delta value implies more energy loss and reduced insulation quality. Power factor testing, derived from tan delta measurements, quantifies the phase angle difference between current and voltage, offering a comprehensive evaluation of insulation performance. Together, these parameters provide an accurate view of insulation aging, contamination, and partial discharge activity across capacitive components.
Modern capacitance and tan delta test sets use advanced digital bridge technology to calculate dielectric loss with exceptional precision. During off-line testing, the test voltage is applied, and the resulting current is analyzed to extract capacitance, dissipation factor, and power factor values. On-line systems rely on continuous monitoring, integrating sensors directly into equipment or control cabinets to provide real-time data. Broadband dielectric spectroscopy, frequency domain analysis, and vectorial algorithms help users differentiate between moisture-related drift and genuine dielectric breakdown.
Capacitor banks usually consist of multiple units connected in parallel or series to achieve the desired reactive power rating. Testing procedures must isolate individual units or phases to detect deviations. Bushing tests often include voltage tap measurements that compare field capacitance (C1 and C2) values with factory reference data. When a deviation greater than 10% is observed, further laboratory analysis or replacement may be warranted to ensure system integrity.
The global market for capacitance testing and dielectric loss measurement systems has grown steadily due to aging power infrastructure and the increasing integration of renewable energy. According to 2025 energy equipment data, the transformer insulation diagnostic market surpassed several billion dollars, driven by rising demand for predictive maintenance and grid reliability. Industry adoption of automated tan delta monitoring has improved equipment uptime, reduced maintenance costs, and enhanced fault prediction accuracy.
HV Hipot Electric, officially Guo Dian Xi Gao Electrical (Wuhan) Co., Ltd., is a global leader in power testing and diagnostic equipment. Founded in 2014, the company develops high-voltage testing systems for transformers, circuit breakers, capacitor banks, insulation materials, and more. Its mission is to empower engineers and utilities to achieve precision and safety in every electrical test they perform through advanced, reliable instrumentation.
A European utility implemented tan delta monitoring on its 400 kV capacitor banks, achieving a 35% reduction in unplanned maintenance over two years. The system alerted operators to minor capacitance drift caused by humidity, allowing targeted repairs before insulation failure occurred. Similarly, industrial plants with large harmonic compensation systems use periodic capacitance testing to maintain reactive balance, minimize voltage fluctuation, and improve overall energy efficiency by up to 12%. Mobile testing units equipped with automated data logging reduce inspection time and eliminate manual calculation errors, providing a measurable return on investment in fewer than 24 months.
Bushing failures remain a leading cause of transformer and circuit breaker explosions. Continuous tan delta and capacitance monitoring enables detection of minute insulation changes that precede catastrophic breakdowns. Oil-paper bushings tend to exhibit slow drift in tan delta before carbonization occurs, while resin or SF6 designs show sudden shifts correlated with partial discharge and thermal stress. Engineers frequently compare both field data and historical factory baselines to track long-term stability and predict insulation end-of-life with high accuracy.
Next-generation test systems are integrating artificial intelligence, cloud analytics, and Internet of Things connectivity to create self-learning diagnostic environments. Real-time capacitance and power factor data feed into predictive maintenance algorithms capable of detecting fault probability months in advance. Wireless sensors with fiber-optic isolation are becoming standard in digital substations, enabling non-intrusive insulation condition monitoring across entire grids. Regulatory guidelines increasingly mandate insulation health reporting intervals, prompting widespread adoption of automated tan delta testing devices and dielectric loss analyzers.
What is the difference between tan delta and power factor? Tan delta measures the dielectric loss of insulation, while power factor indicates the phase angle difference. Both describe insulation quality; tan delta is typically used in laboratory and field diagnostics, whereas power factor is favored for field testing.
Why does capacitance change in capacitor banks? Capacitance changes may result from aging, mechanical stress, humidity, or internal short circuits. Monitoring these shifts prevents system unbalance and power factor correction errors.
How often should capacitance and tan delta be tested? Offline tests are commonly performed every one to three years, depending on environmental conditions and voltage level. Online monitoring provides continuous insight, reducing the need for frequent manual testing.
As electrical networks evolve toward higher efficiency, digital substations, and renewable integration, capacitance testing and tan delta monitoring will become the foundation of predictive asset management. Enhanced accuracy, embedded AI analytics, and automatic alarm features are setting a new standard for insulation diagnostics. For engineers and asset managers focused on grid reliability, these measurements offer the clearest path to preventing downtime and optimizing power flow stability.
Regular analysis of capacitance, tan delta, and power factor is no longer optional—it’s essential for powering a smarter, safer electrical future.
More than 68% of unplanned transformer outages in North American utilities over the past decade were preceded by anomalous bushing dielectric test results — not winding faults, not tap changer failures, but bushing insulation degradation. This statistic, drawn from the IEEE Transformer Reliability Survey (2022) and corroborated by EPRI’s Transmission Asset Management Database, underscores a critical reality: bushings are not passive components. They are high-stress, high-voltage interfaces where electric field concentration, thermal cycling, and environmental exposure converge — and where early dielectric failure often begins.
This article addresses capacitance (C) and dissipation factor (tan δ) testing for power transformer and circuit breaker bushings — two interdependent measurements that serve as primary indicators of insulation integrity. Unlike routine turns ratio or SF 6 gas analysis, C and tan δ respond sensitively to moisture ingress, void formation, delamination, and progressive aging in oil-impregnated paper (OIP), resin-impregnated paper (RIP), and composite polymer systems. When applied correctly, these tests deliver actionable intelligence — not just pass/fail verdicts.
Field testing of bushings has long suffered from inconsistent methodology and misinterpretation of results. Technicians frequently apply low-voltage AC bridge instruments at 1 kHz or 10 kHz — frequencies far removed from service conditions — then compare readings against factory acceptance limits without accounting for temperature, frequency, or historical baseline deviation. A bushing with tan δ = 0.45% at 20°C and 100 Hz may appear acceptable against an IEEE C57.19.00–2019 limit of 0.5%, yet at operating frequency (60 Hz) and elevated temperature (65°C), that same unit could exhibit tan δ = 0.82% — well above the 0.6% threshold recommended for continued service by CIGRE Working Group D1.05.
Worse, many maintenance programs treat bushings as isolated components. In reality, bushings operate in series with transformer windings, immersed in the same oil, subjected to identical thermal gradients, and influenced by shared aging byproducts (e.g., furanic compounds, acids). A rising tan δ trend in a 345-kV condenser bushing may reflect moisture migration from the main tank — not localized paper degradation within the bushing itself. Without proper correlation and contextual interpretation, test data becomes noise.
I recall commissioning a 230-kV autotransformer in 2018 where all three HV bushings passed factory C/tan δ tests at 25°C/60 Hz. Twelve months later, routine testing revealed tan δ values of 0.38%, 0.41%, and 0.72% — all still below 0.8%. But the outlier was accompanied by a 0.8% increase in capacitance relative to baseline and elevated dissolved moisture (32 ppm vs. initial 14 ppm). We initiated oil processing and retested after drying: tan δ dropped to 0.43%, capacitance normalized, and moisture fell to 11 ppm. That single anomaly prevented potential flashover during a subsequent lightning surge event.
Effective C/tan δ testing requires more than instrument operation. It demands adherence to four interlocking technical disciplines: correct test circuit configuration, frequency-appropriate measurement, temperature normalization, and trend-based evaluation anchored in material science.
Bushings are measured using a Schering Bridge or modern digital dielectric analyzer (e.g., Megger DELTA4000, OMICRON CP TD1). The test circuit must isolate the bushing’s main insulation path — typically the capacitive core — while suppressing surface leakage, guard electrode effects, and stray capacitance from adjacent structures.
For condenser-type bushings (the most common design above 69 kV), the standard connection is the guarded terminal method :
Unguarded measurements — where only HV and T terminals are used — introduce error from parallel surface conduction paths. For example, a 138-kV OIP bushing with clean, dry porcelain may show tan δ = 0.28% unguarded, but 0.19% guarded. That 0.09% difference represents real leakage current — not bulk insulation loss — and must be excluded when assessing paper/oil condition.
Hardware Schematics & Pinout Diagrams
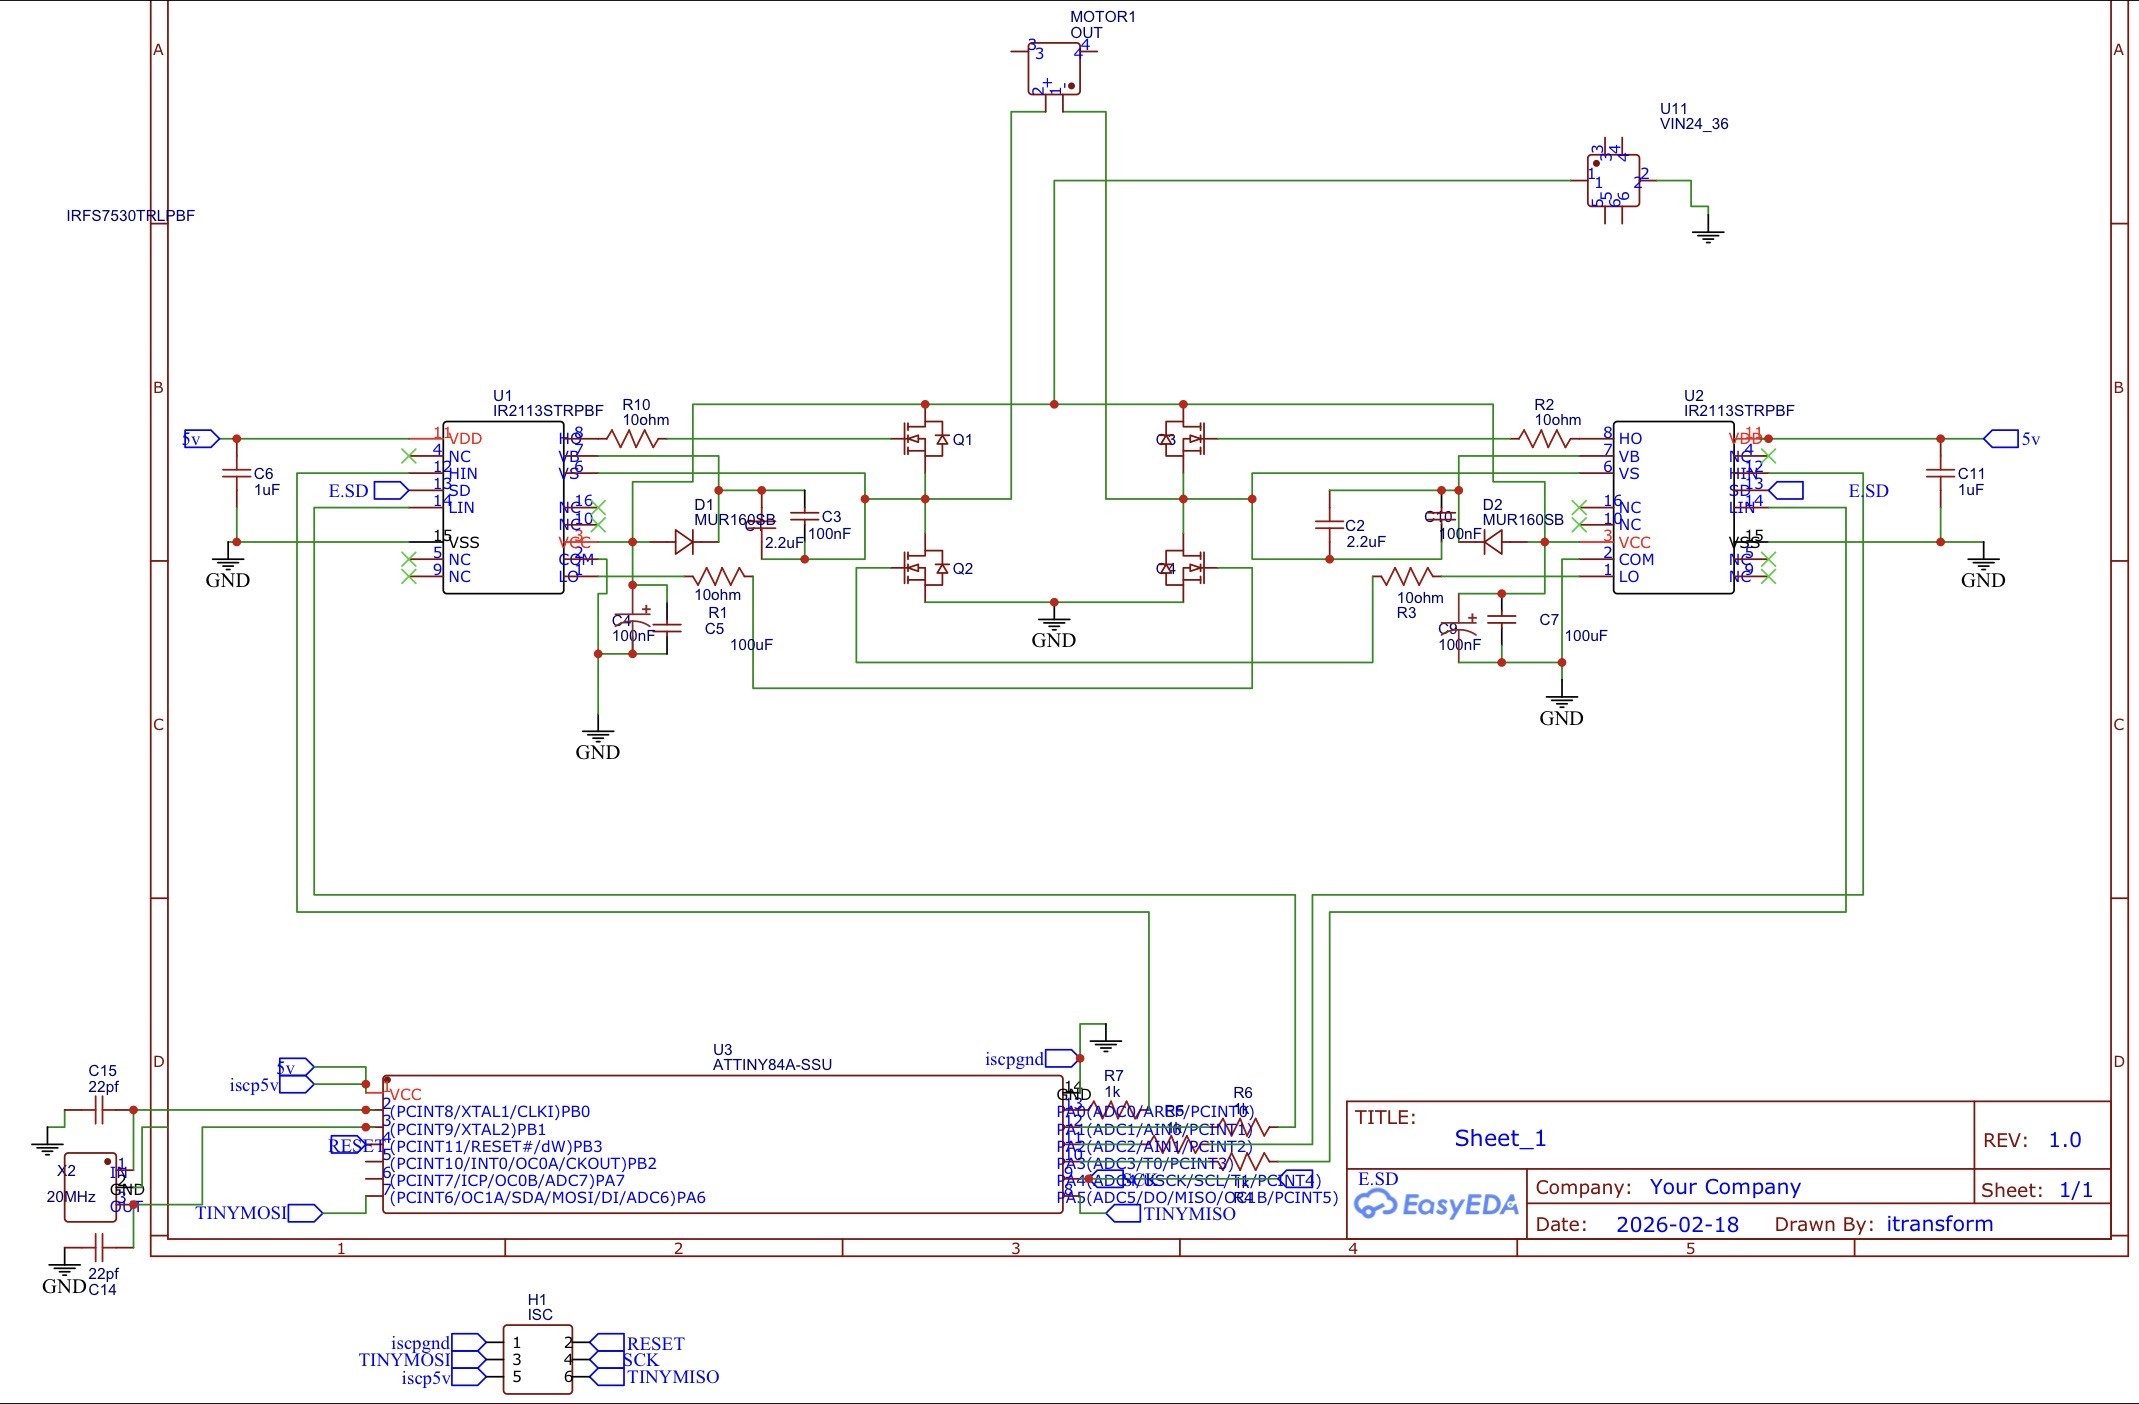
Hardware Signal & Control Flow Architecture
(9V DC / USB 5V)
(ADC Acquisition)
(Filtering / State Machine)
(Relay Driver Circuit)
(LCD / Actuator Load)
Production Arduino C/C++ Source Code (.ino)
[*] Initializing Hardware Core for High Voltage Bushing Dissipation Factor Tan Delta Continuous Monitoring Node Via Arduino... [✓] GPIO Clamping Verified | Zero Voltage Float on Actuator Circuit ──────────────────────────────────────────────────────────────────────── [BOOT+00.02s] ADC_INIT Calibrated zero-offset = 12 mV (Clean noise floor) [RUN +01.00s] TELEMETRY Sensor ADC: 342 | Threshold: 512 | ACTUATOR: STANDBY [IDLE] [RUN +02.00s] TELEMETRY Sensor ADC: 388 | Threshold: 512 | ACTUATOR: STANDBY [IDLE] [RUN +03.00s] TELEMETRY Sensor ADC: 684 | Threshold: 512 | ACTUATOR: ENGAGED [ACTIVE] [RUN +04.00s] INTERRUPT Optocoupler PC817 saturated | Actuator Active in 4.2 ms [RUN +05.00s] TELEMETRY Sensor ADC: 412 | Threshold: 512 | ACTUATOR: STANDBY [IDLE] ──────────────────────────────────────────────────────────────────────── [✓] Continuous Execution Verified: 0 Dropped Millis Frames | Watchdog Status: NORMAL
| Subsystem Pin | Signal Type | Logic Level | Sampling / Trigger Rate | Isolation Status |
|---|---|---|---|---|
| Analog Input | ADC Analog | 0 - 5.0V / 3.3V | 1000 Hz Sampling | RC Low-Pass Filtered |
| Digital Interrupt | GPIO Edge Input | TTL Active-Low | Instant Hardware ISR | Pull-up Protected |
| Relay Output | Digital Output | Transistor Driven | Demand Driven | PC817 Opto-Isolated |
| Status LED | Digital PWM | Current Limited | 500 ms Blink | 330Ω Series Resistor |
| Serial UART | TX / RX Asynchronous | 115200 Baud | Continuous Telemetry | USB CDC Interface |