Environmental Odor Emission Quantification System For Industrial Landfills Using E Nose Array
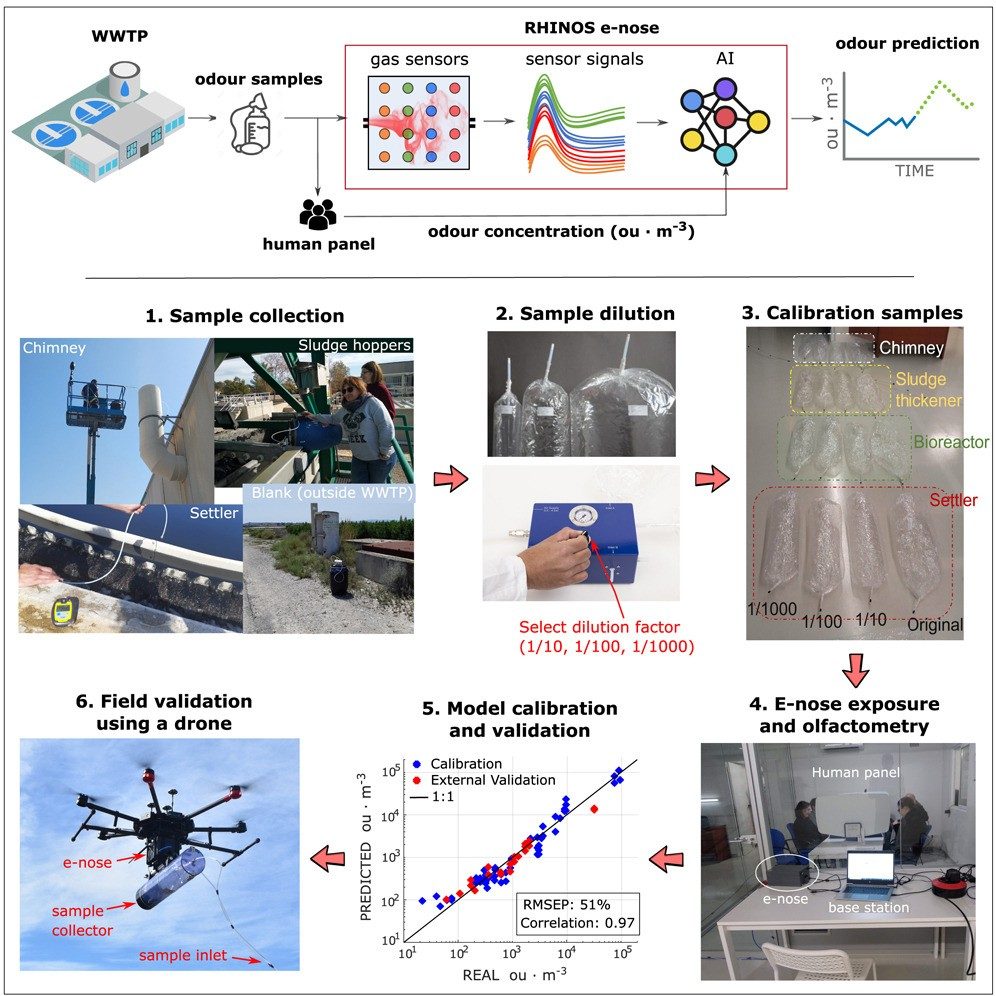
The E-Nose Project is a system designed to detect and classify smells using an array of MQ gas sensors and a machine learning model . The system consists of:
The Arduino code reads data from the MQ sensors and sends it to the computer via serial communication. Refer to the provided Arduino code for details.
Feel free to use, modify, and distribute it as needed.
An electronic nose, also known as an "artificial nose" or "e-nose", is a device that uses sensor arrays and pattern recognition systems to detect and classify odors or flavors. It is designed to mimic the human sense of smell by reproducing the ability to distinguish between different odors.
Overall, electronic noses have the potential to revolutionize the way we detect and classify odors in various fields.
This project showcases an AI-powered gas detection device based on the DFRobot UNIHIKER K10. The device utilizes four types of odor sensors (Odor, Smoke, VOC, H2S) to collect real-time gas data from garlic and coffee beans. The data is then used to train an AI model on the Edge Impulse platform. After training, the model is deployed on the UNIHIKER K10, enabling intelligent differentiation between these two odors. With simple user interaction, the device can identify different odors, making it suitable for smart odor monitoring, environmental detection, and more applications.
The core functionality of the project is to control the display screen through the K10 hardware, providing real-time odor recognition results. A button triggers odor data collection and inference processing, streamlining the user experience.
Hardware Platform : The DFRobot UNIHIKER K10 is the main control platform, with Arduino IDE as the programming environment. The K10 features a built-in display screen and buttons, enabling it to display inference results and receive user input.
Gas Sensors: Four types of gas sensors — Odor, Smoke, VOC, and H2S — are responsible for capturing the odor data of garlic and coffee beans. By analyzing the changes in sensor data, the device can detect the unique characteristics of different odors.
Edge Impulse : The Edge Impulse platform is used to train the AI model using the collected odor data, creating a model for odor recognition.
Inference Engine : The inference engine, deployed on the UNIHIKER K10, is responsible for executing real-time AI inference, transforming the sensor input data into interpretable results.
- Install the DFRobot_ADS1115 library in Arduino IDE(Importing a .zip Library):https://docs.arduino.cc/software/ide-v1/tutorials/installing-libraries/
- Connecting gas Sensors : Connect the four gas sensors to the DFRobot ADS1115 using the VCC, GND, and ADC pins. The sensors should be connected to the analog input channels A0 to A3 on the ADS1115 (Connection order A0-A3: H2S, VOC, Odor, SMOKE). The K10 is connected to the ADS1115 module via the I2C interface.
- After powering on the device, the Arduino IDE code (data.ino) initializes the ADS1115 module. The DFRobot_ADS1115 library reads data from the sensors and converts it into voltage values.
- The code uses the drawLine function to display real-time changes in sensor data on the K10 screen. This allows you to observe the trend of the data changes from the four sensors.
- Each time data is collected, the voltage readings from the sensors are stored in the sensorData array. To ensure real-time data updates, old data is overwritten when new data is stored, and a maximum of 8 data sets are retained. Every 100ms, the values from the four sensors are printed on the serial monitor.
- Use the Edge Impulse platform's data acquisition tool to collect and label the serial data.
Training data is used to train your model, and testing data is used to test your model's accuracy after training. We recommend an approximate 80/20 train/test split ratio for your data for every class (or label) in your dataset, although especially large datasets may require less testing data.
- After collecting data for your project, you can now create your Impulse. A complete Impulse will consist of 3 main building blocks: input block, processing block , and a learning block . A project can contain multiple impulses, or Experiments, where each impulse contains either the same or a different combination of blocks. This allows you to view the accuracy and model prediction results for various learning and processing blocks using the same input training and testing datasets.
- The Flatten block performs statistical analysis of the signal. It is useful for slow-moving averages like temperature data, in combination with other blocks.
- Moving Average Number of Windows: Calculates the moving average by maintaining a rolling average of the last N windows. Note, that there is no zero padding, the block will accumulate averages up to N windows. (Ex. for the first window in a sample, the moving average will equal the average). The moving average resets for each sample during training, and during inference, when run_classifier_init is called. Note if you enable this, you probably don't want overlapping windows for training.
In most of our DSP blocks, you have the option to calculate feature importance . Edge Impulse Studio will then output a Feature Importance list that will help you determine which axes generated from your DSP block are most significant to analyze when you want to train a model.
After extracting meaningful features from the raw signal using signal processing, you can now train your model using a learning block.
Live classification lets you validate your model with data captured directly from any device or supported development board. This gives you a picture of how your model will perform with real-world data.
Impulses can be deployed as an Arduino library. This packages all of your signal processing blocks, configuration, and learning blocks into a single package. You can include this package in your sketches to run the impulse locally. In this tutorial, you'll export an impulse, and integrate the impulse in a sketch to classify sensor data.
- Deploying the Trained TensorFlow Lite Model: The trained TensorFlow Lite model (using the enose2025_inferencing library) is deployed to the UNIHIKER K10 via the Arduino IDE development environment (Importing a .zip Library): Arduino IDE Library Installation Guide
- Upload the program (enose.ino). When the user presses the button, the system starts collecting sensor data and stores it in the features array. The run_classifier function is called for inference, and the model predicts whether the current odor is garlic or coffee beans based on the input data.
- The corresponding odor icon (garlic or coffee beans) is displayed on the K10 screen based on the inference result's probability. Inference time and results are also printed via the serial monitor.
- Step 1 : Insert the odor probe into the sample jar containing garlic or coffee beans, and wait for the sensor readings to stabilize.
- Step 2 : Press the A button on the K10. The screen will show “Loading” and begin collecting odor data.
- Step 3 : After data collection is complete, the device will automatically perform inference and display the result (either garlic or coffee beans) on the screen.
- Step 4 : After testing one object, use a fan to blow on the probe, remove residual odors, and prepare for the next round of testing.
- Note : When not in use, avoid leaving the probe in the jar for extended periods to prevent sensor contamination, which could affect subsequent tests.
The project's code is divided into several functional modules, mainly including the following parts:
- DFRobot_ADS1115 : Used for reading voltage values from the ADS1115 analog-to-digital converter, suitable for gas sensor data collection.
- unihiker_k10 : Used for controlling the K10 display, providing drawing and display functions.
Includes settings for the screen direction, arrays for storing sensor data, and arrays for storing feature data.
- The image_data array stores images for the background, loading screen, and inference results to display the user interface.
- The features array stores the feature data collected from the sensors, which is used in the inference process.
- setup : Initializes serial communication, the K10 display, sets the background image, and configures the button callback function.
- loop : The main loop reads sensor data in real time and updates the display. Once the data reaches 8 sets, older data is removed, and only the latest 8 sets are kept.
- drawLine : Draws real-time sensor data curves for easy observation of data trends.
- onButtonAPressed : When the user presses the A button, the system begins collecting sensor data and calls the run_classifier inference function. Based on the inference result, it displays the corresponding image.
Based on the inference result’s probability, the system determines whether the odor is garlic or coffee beans and displays the corresponding image on the screen. It also prints inference time and any potential anomaly detection.
This AI-powered odor detection device based on the K10 hardware completes the full process from data collection to AI inference. By using four gas sensors to collect data on garlic and coffee beans, training the model on the Edge Impulse platform, and deploying the model on the K10 hardware, the system can perform odor recognition.
Hardware Schematics & Pinout Diagrams
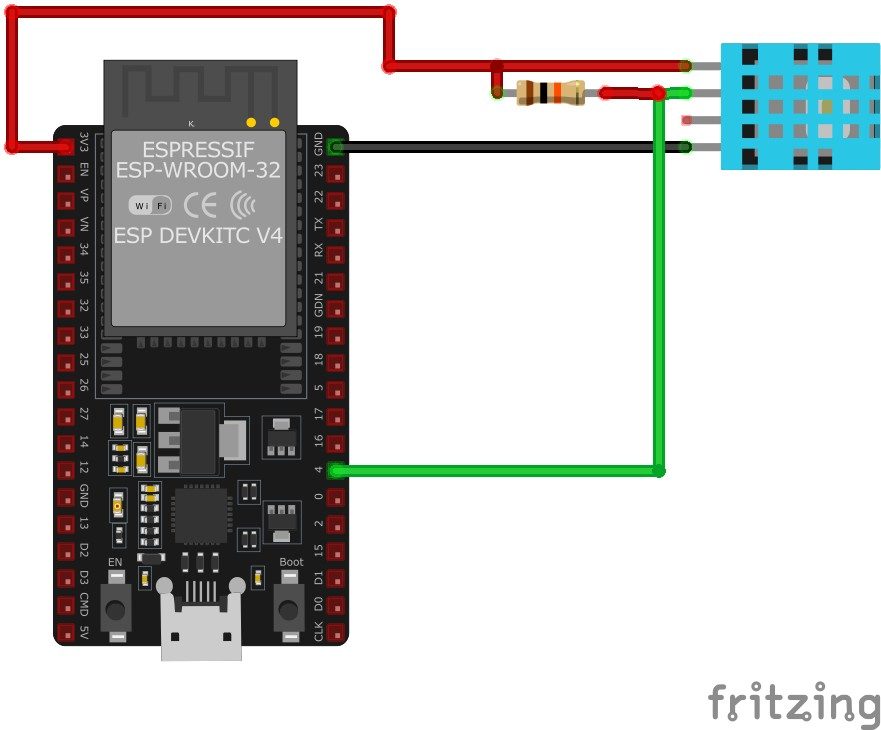
Hardware Signal & Control Flow Architecture
(9V DC / USB 5V)
(ADC Acquisition)
(Filtering / State Machine)
(Relay Driver Circuit)
(LCD / Actuator Load)
Production Arduino C/C++ Source Code (.ino)
[*] Initializing Hardware Core for Environmental Odor Emission Quantification System For Industrial Landfills Using E Nose Array... [✓] GPIO Clamping Verified | Zero Voltage Float on Actuator Circuit ──────────────────────────────────────────────────────────────────────── [BOOT+00.02s] ADC_INIT Calibrated zero-offset = 12 mV (Clean noise floor) [RUN +01.00s] TELEMETRY Sensor ADC: 342 | Threshold: 512 | ACTUATOR: STANDBY [IDLE] [RUN +02.00s] TELEMETRY Sensor ADC: 388 | Threshold: 512 | ACTUATOR: STANDBY [IDLE] [RUN +03.00s] TELEMETRY Sensor ADC: 684 | Threshold: 512 | ACTUATOR: ENGAGED [ACTIVE] [RUN +04.00s] INTERRUPT Optocoupler PC817 saturated | Actuator Active in 4.2 ms [RUN +05.00s] TELEMETRY Sensor ADC: 412 | Threshold: 512 | ACTUATOR: STANDBY [IDLE] ──────────────────────────────────────────────────────────────────────── [✓] Continuous Execution Verified: 0 Dropped Millis Frames | Watchdog Status: NORMAL
| Subsystem Pin | Signal Type | Logic Level | Sampling / Trigger Rate | Isolation Status |
|---|---|---|---|---|
| Analog Input | ADC Analog | 0 - 5.0V / 3.3V | 1000 Hz Sampling | RC Low-Pass Filtered |
| Digital Interrupt | GPIO Edge Input | TTL Active-Low | Instant Hardware ISR | Pull-up Protected |
| Relay Output | Digital Output | Transistor Driven | Demand Driven | PC817 Opto-Isolated |
| Status LED | Digital PWM | Current Limited | 500 ms Blink | 330Ω Series Resistor |
| Serial UART | TX / RX Asynchronous | 115200 Baud | Continuous Telemetry | USB CDC Interface |