Design Of An Arduino Based Digital Phonocardiogram For Heart Murmur Classification Via Wavelet Filtering
Cardiac auscultation provides valuable insights into the mechanical activity of heart, and remains the gold standard for diagnosis of a wide range of cardiovascular diseases. Phonocardiogram (PCG)—the systematic recording of heart sounds by means of a digital stethoscope, is a clinically significant method to study the pathology of the four heart valves (i.e., the mitral valve, tricuspid valve, aortic valve, and pulmonary valve). This is because the PCG could record abnormal sounds, known as heart murmurs, made by heart valves as they open and close during cardiac cycle. Heart murmurs, when present, often indicate the presence of a heart valve disease, e.g., mitral regurgitation, mitral stenosis, congenital heart disease, septal defects, patent ductus arteriosus in newborns, defective cardiac valves, rheumatic heart disease, etc [ 1 ] . Thus, early murmur detection, classification, and grading analysis in an automated fashion to help diagnose a valvular heart disease at an early stage is the need of the hour [ 2 ] .
PCG signal acquisition is typically done from following four chest locations where the valves can be best heard: Aortic area, Pulmonic area, Tricuspid area, and Mitral area [ 3 ] . For a normal sinus cardiac cycle, the PCG signal captures two fundamental heart sounds, first is called S1 sound while second is called S2 sound. S1 signifies the start of isovolumetric ventricular contraction with the closing of the mitral and tricuspid valves amid rapid increase in pressure within the ventricles. S2, on the other hand, implies the start of diastole with the closing of the aortic and pulmonic valves. In addition to S1 and S2 sounds, the mechanical activity of the heart may occasionally give rise other sounds which include: third heart sound (S3), the fourth heart sound (S4), systolic ejection click (EC), mid-systolic click (MC), diastolic sound or opening snap (OS), and heart murmurs (due to turbulent flow of blood due to malfunctioning of heart valves) [ 4 ] .
PCG signal analysis for abnormal heart beat detection and for murmur detection has traditionally been done using classical signal processing techniques [ 5 ] . More recently, there has been enormous interest in utilizing tools from machine learning [ 6 ] , deep learning [ 7 ] , and transfer learning [ 8 ] in order to do heart sounds classification (see the review articles [ 1 ] , [ 2 ] , and references therein for more in-depth discussion of the related work).
Inline with the recent surge of interest in utilizing deep learning methods for PCG signal analysis, this work utilizes two public PCG datasets (PCG 2022 dataset and PCG 2016 dataset) from Physionet database [ 9 ] to train and test three custom neural networks (NN), i.e., 1D-convolutional neural network (CNN), long short-term memory (LSTM)-recursive neural network (RNN), convolutional-RNN (C-RNN) for heart murmur and abnormal PCG detection.
Dealing with the noisy datasets: The two PCG datasets are occasionally corrupted with noise (e.g., baby crying, background sounds, etc.). Thus, we pre-process the two datasets in order to split each PCG recording into smaller segments using a custom-designed GUI framework. This way, we systematically identify and remove the noise-only segments. We also perform ablation study to determine the optimal window size for segmentation.
Dealing with small-sized datasets: We note that both PCG datasets are small in size; therefore, we utilize Wavelet scattering transform –a tool that efficiently handles small datasets– for feature extraction and for the time-frequency analysis on our denoised, pre-processed, segmented data.
Dealing with the imbalanced datasets: We minimize the class imbalance in both datasets by reducing the size of the murmur absent class (by downsampling the murmur absent class by weighted random sampling). The weighted random sampling method assigns a certain weight to each instance in the training data, allowing instances from the minority class to be sampled more than once, which in turn leads to increasing the total number of instances from the minority class due to repetition.
Design of four experiments: We design four experiments to evaluate the performance of our NN models on following four datasets: 1) PCG 2022 dataset as is, 2) PCG 2022 dataset with unknown class removed, 3) PCG 2022 dataset with noise-only segments removed, and 4) PCG 2016 dataset as is.
Voting-based approach: For the experiments E1-E3, we also evaluate a voting based approach where we group all the samples that belong to the same heart auscultation location of a given patient. We then inspect the classification result of each sample, and finally choose the label that has the maximum number of votes.
Outline. The rest of this paper is organized as follows. Section II describes selected related work on murmur detection and heart valve disease classification. Section III outlines essential details of the two public datasets used, pre-processing done, and time-frequency domain methods for feature extraction. Section IV presents three deep learning classifiers for murmur detection and abnormal PCG detection. Section V discusses performance results for all three classifiers for both datasets. Section VI concludes the paper.
Broadly speaking, the relevant literature on PCG signal analysis has attempted to solve following major problems, to date: i) identification of fundamental heart sounds (S1 and S2), also known as lub-dub sounds [ 13 ] , ii) abnormal PCG detection (by identifying sounds other than the normal lub-dub sounds) [ 14 ] , iii) heart sound classification (normal sounds, murmurs, extra clicks, artifacts) [ 15 ] , iv) heart murmur detection [ 16 ] , v) heart valve disease classification (by means of heart murmur classification) [ 17 ] , and vi) PCG signal denoising methods [ 18 ] . Lately, there is a work which attempts to do automatic murmur grading analysis [ 19 ] at the patient-level, and has the potential to do disease staging and progression analysis.
Since this work focuses mainly on automatic heart murmur and abnormal PCG detection, selected work on these two problems is discussed as follows. [ 10 ] , [ 11 ] , [ 12 ] utilize the PCG 2022 dataset, and implement a light-weight CNN, a parallel hidden semi-Markov model, and a heirarchical multi-scale CNN, respectively, for murmur detection and clinical outcome prediction. [ 22 ] utilizes PCG 2016 dataset, applies multiple time-frequency analysis methods, e.g., discrete wavelet transform, mel-frequency cepstral coefficients etc., along with a feedforward neural network in order to do abnormal PCG detection, achieving 97.1% accuracy. [ 23 ] computes short time Fourier transform of the PCG signals without doing any segmentation, implements a custom CNN, and achieves an accuracy of 95.4%, and 96.8%, on PCG 2016 dataset and PASCAL dataset, respectively. [ 24 ] utilizes two PCG datasets to evaluate their custom CNN model, as well as two pre-trained models (i.e., VGGNet-16, ResNet-50) in order to do heart valve disease (HVD) classification. They claim to achieve an overall accuracy of 99% to classify the following HVD: aortic stenosis, mitral stenosis, aortic regurgitation, mitral regurgitation, and mitral valve prolapse. [ 25 ] utilized a private dataset (with data collected at PKU Muhammadiyah Yogyakarta Hospital, Indonesia), and implemented a custom CNN model in order to HVD classification for the following diseases: angina pectoris, congestive heart failure, and hypertensive heart disease. They reported an accuracy of 85% for their HVD classification problem. [ 26 ] aimed at intelligent diagnosis of murmurs in pediatric patients with congenital heart disease. They applied segmentation method to extract the first and second heart sounds from the PCG signals, and used them as input to their feedforward neural network classifier, resulting in HVD detection accuracy of 93%. [ 27 ] utilizes the PASCAL dataset and aims to classify PCG signals into three classes (normal, systolic murmur, diastolic murmur). To this end, they extract various time-domain features, frequency-domain features, and statistical features, and pass them to three classifiers: k-NN, fuzzy k-NN and a feedforward neural network. They report a classification accuracy of 99.6%, that is achieved by the fuzzy k-NN. [ 28 ] utilizes the PCG 2016 dataset, extracts time-domain, frequency-domain, and time-frequency domain features from the PCG signals, and implements an ensemble of 20 feedforward neural networks in order to do abnormal PCG detection, achieving an overall accuracy of 91.5%. [ 29 ] utilizes the PCG 2016 dataset, extracts time-domain, frequency-domain and time-frequency domain features, does feature selection and implements a two-layer feedforward neural network for abnormal PCG detection, resulting in an accuracy of 85.2%. Finally, [ 30 ] trains a custom neural network using a dataset that consisted of 34 hours of heart sound recordings. Their murmur detection algorithm results in a sensitivity of 76.3%, specificity of 91.4%. Furthermore, they report an increase in sensitivity to 90% when they omit soft murmurs with grade 1.
As mentioned earlier, this work utilizes two public PCG datasets: 1) CirCor Digiscope PCG dataset from PhysioNet (called PCG 2022 dataset, in this work) [ 31 ] , 2) PCG dataset from PhysioNet (called PCG 2016 dataset, in this work). Below, we describe the key details of the two datasets, followed by the key pre-processing steps performed on each dataset.
Hardware Schematics & Pinout Diagrams
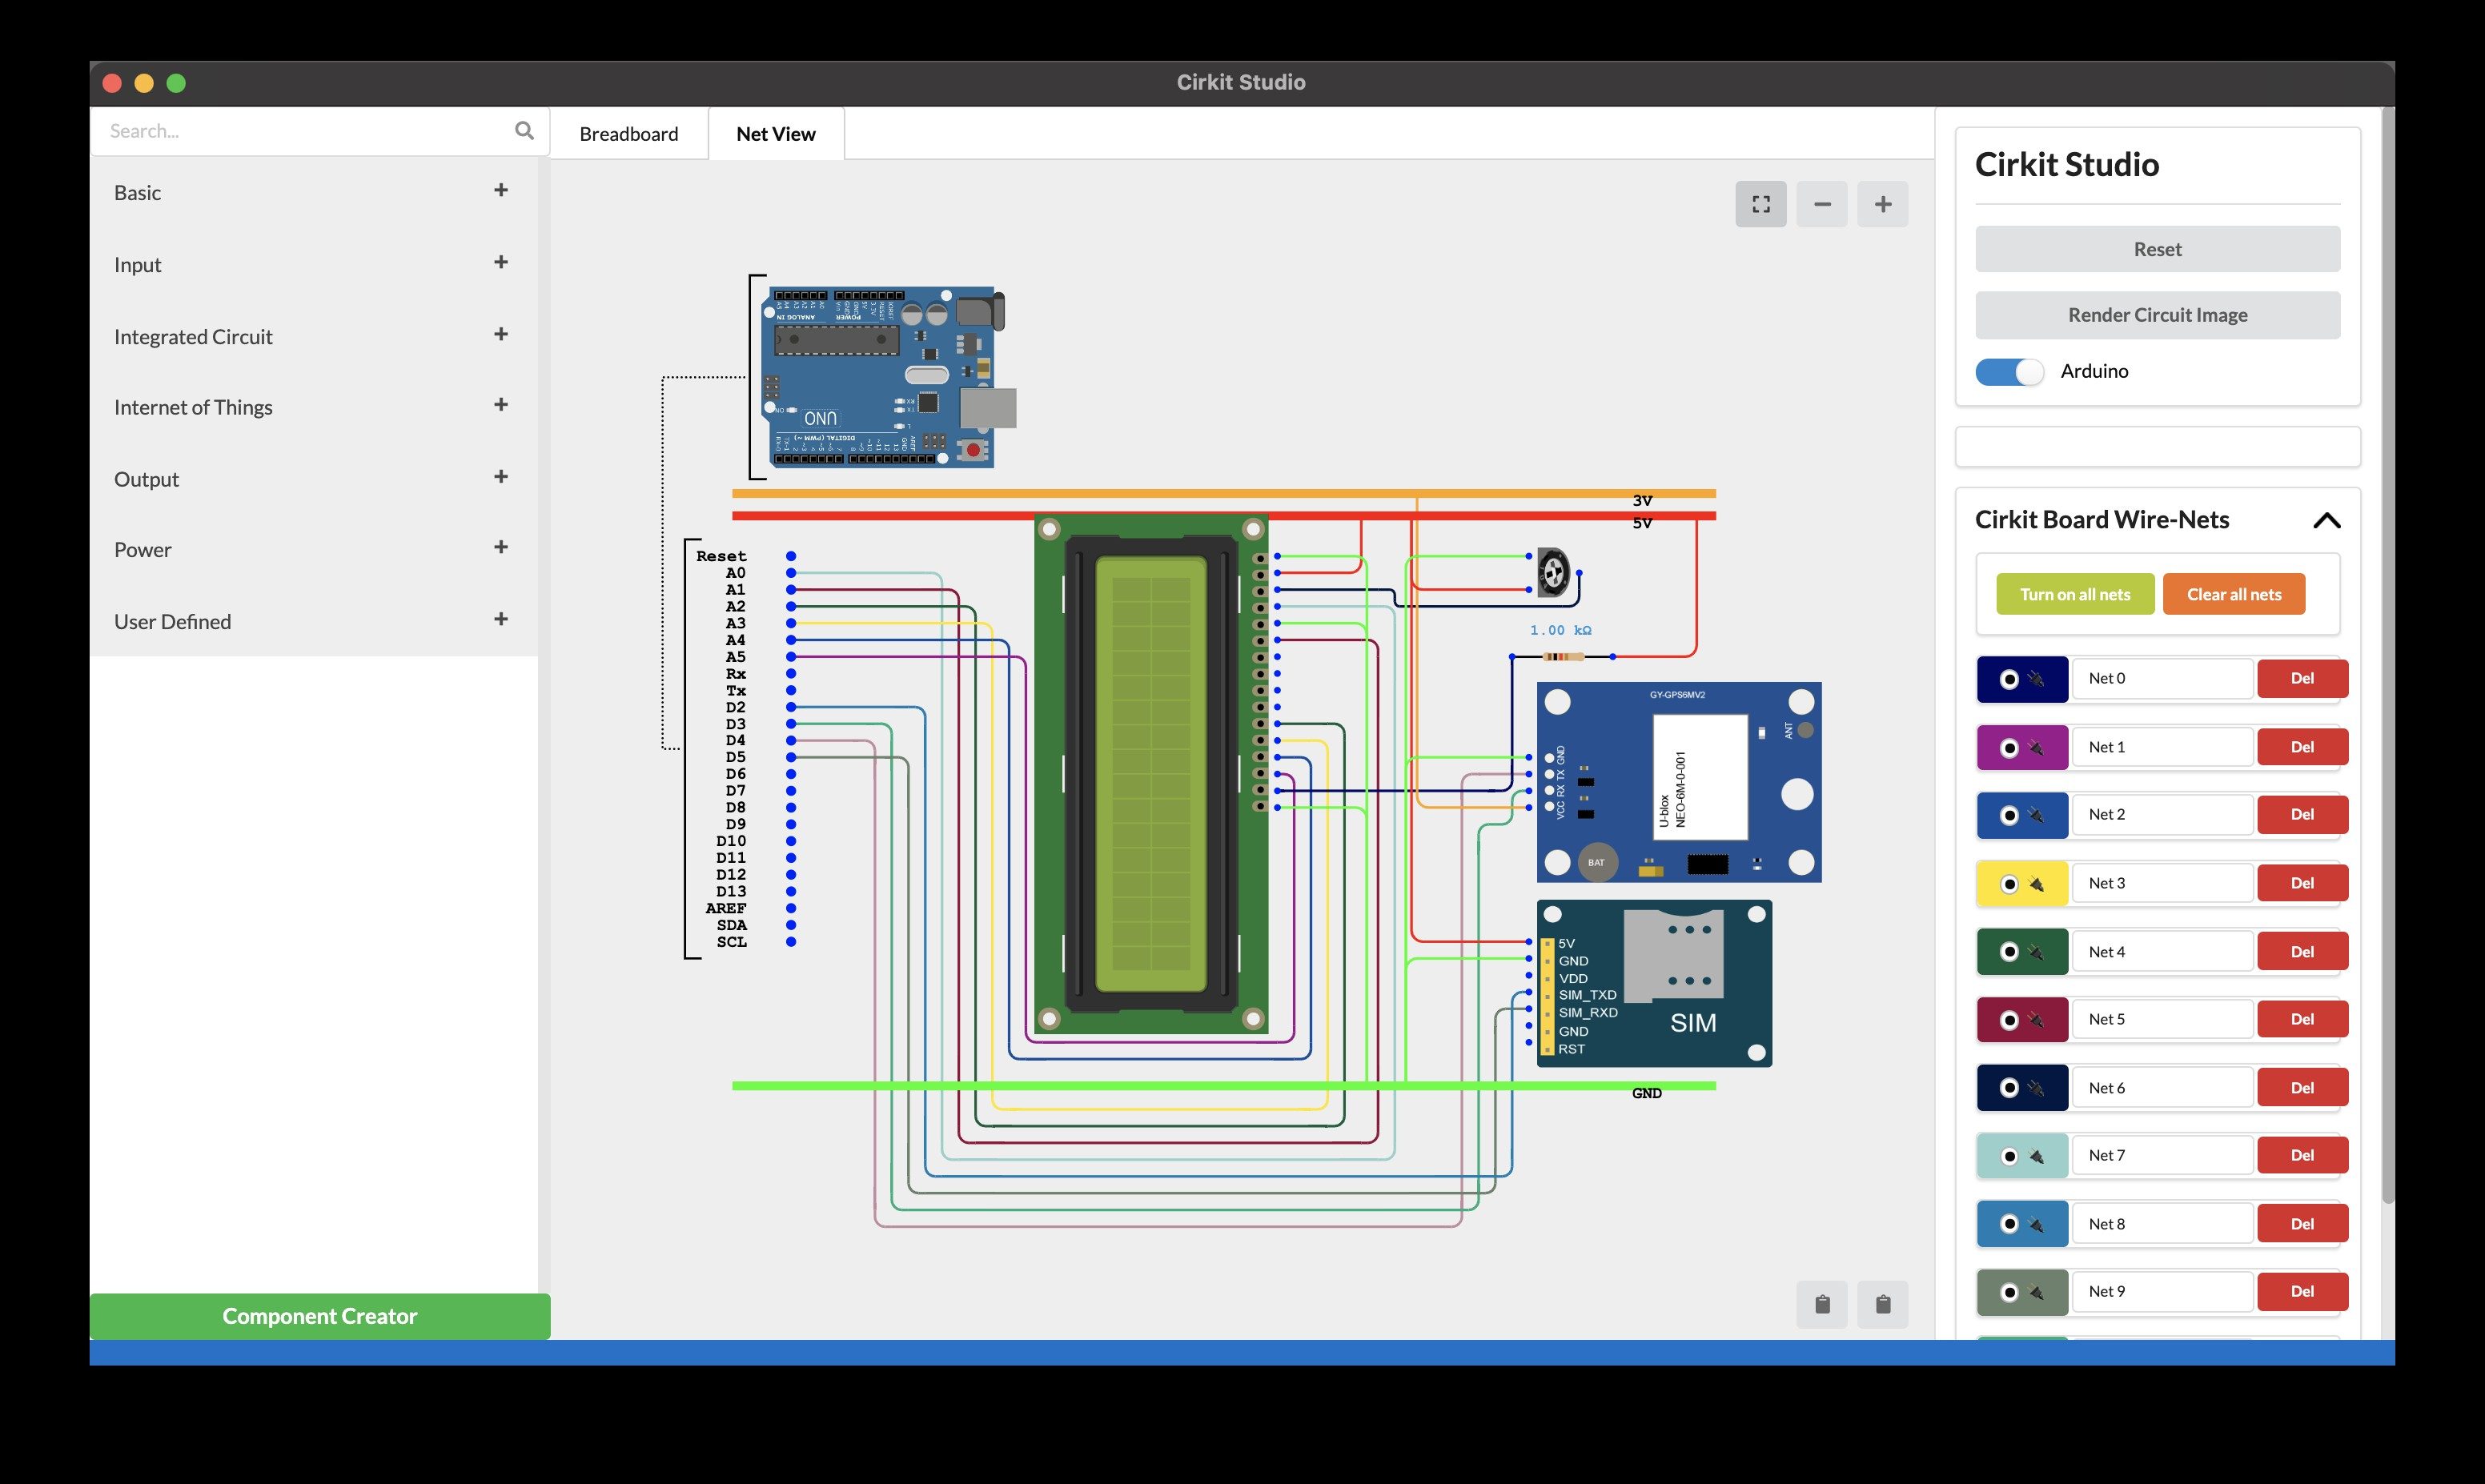
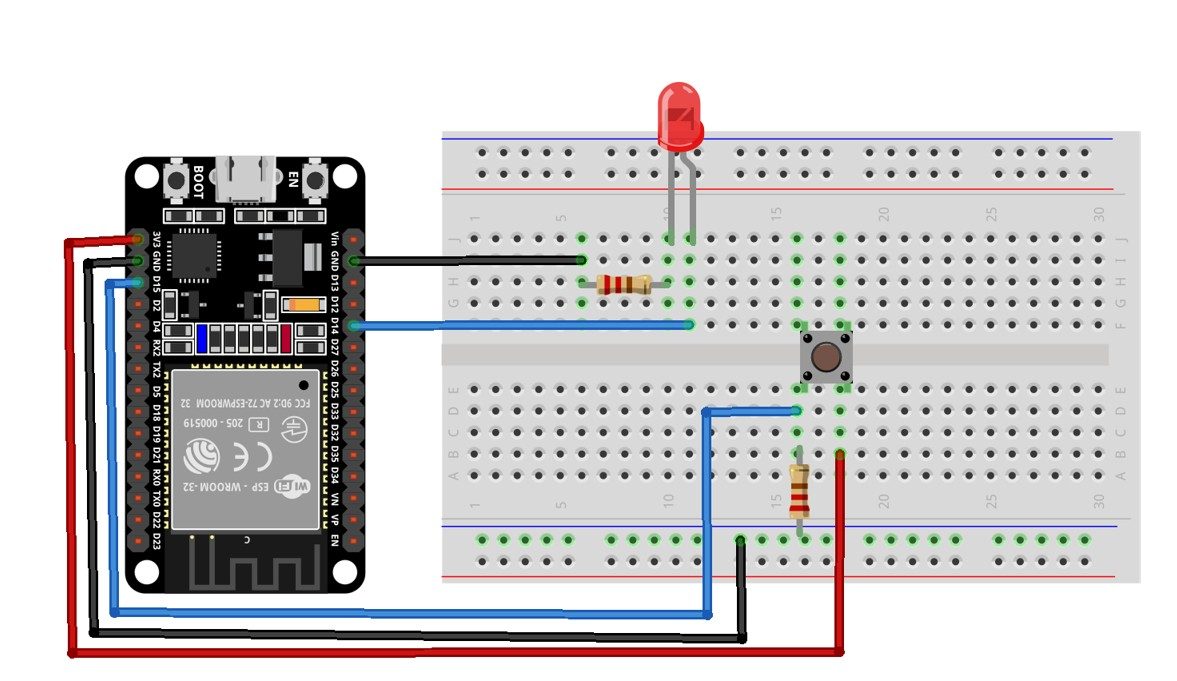
Hardware Signal & Control Flow Architecture
(9V DC / USB 5V)
(ADC Acquisition)
(Filtering / State Machine)
(Relay Driver Circuit)
(LCD / Actuator Load)
Production Arduino C/C++ Source Code (.ino)
[*] Initializing Hardware Core for Design Of An Arduino Based Digital Phonocardiogram For Heart Murmur Classification Via Wavelet Filtering... [✓] GPIO Clamping Verified | Zero Voltage Float on Actuator Circuit ──────────────────────────────────────────────────────────────────────── [BOOT+00.02s] ADC_INIT Calibrated zero-offset = 12 mV (Clean noise floor) [RUN +01.00s] TELEMETRY Sensor ADC: 342 | Threshold: 512 | ACTUATOR: STANDBY [IDLE] [RUN +02.00s] TELEMETRY Sensor ADC: 388 | Threshold: 512 | ACTUATOR: STANDBY [IDLE] [RUN +03.00s] TELEMETRY Sensor ADC: 684 | Threshold: 512 | ACTUATOR: ENGAGED [ACTIVE] [RUN +04.00s] INTERRUPT Optocoupler PC817 saturated | Actuator Active in 4.2 ms [RUN +05.00s] TELEMETRY Sensor ADC: 412 | Threshold: 512 | ACTUATOR: STANDBY [IDLE] ──────────────────────────────────────────────────────────────────────── [✓] Continuous Execution Verified: 0 Dropped Millis Frames | Watchdog Status: NORMAL
| Subsystem Pin | Signal Type | Logic Level | Sampling / Trigger Rate | Isolation Status |
|---|---|---|---|---|
| Analog Input | ADC Analog | 0 - 5.0V / 3.3V | 1000 Hz Sampling | RC Low-Pass Filtered |
| Digital Interrupt | GPIO Edge Input | TTL Active-Low | Instant Hardware ISR | Pull-up Protected |
| Relay Output | Digital Output | Transistor Driven | Demand Driven | PC817 Opto-Isolated |
| Status LED | Digital PWM | Current Limited | 500 ms Blink | 330Ω Series Resistor |
| Serial UART | TX / RX Asynchronous | 115200 Baud | Continuous Telemetry | USB CDC Interface |