Coastal Beach Rip Current Early Warning System Using Drifting Accelerometer Sensor Pods
Drowning is the third leading cause of accidental death in New Zealand, and the vast majority of lifeguard rescues are due to rip currents—hard to observe unless you’re already in peril. In order to help fix this problem, Victoria University of Wellington students Hannah Tilsley and Chamonix Stuart designed the “Nah Yeah Buoy” water safety system.
The system consists of a network of sensing buoys and a mobile app. The buoys feature a water flow sensor on their base to measure currents, and use an Arduino to control lights on the top to shine according to the water speed. Green means it’s safe to swim, yellow is for caution, and red indicates danger, in similar manner to how traffic lights. Additionally, two-way wireless communication sends alerts to lifeguards on the shore, who can override the lights to warn of danger when needed.
As seen here , the project was named a runner-up in the 2019 New Zealand James Dyson Award .
The “Nah Yeah Buoy” is an adaptive system for water safety designed to identify rip currents near beaches, visualise their locations and movements, and provide interactive alerts and warnings for lifeguards and water users.
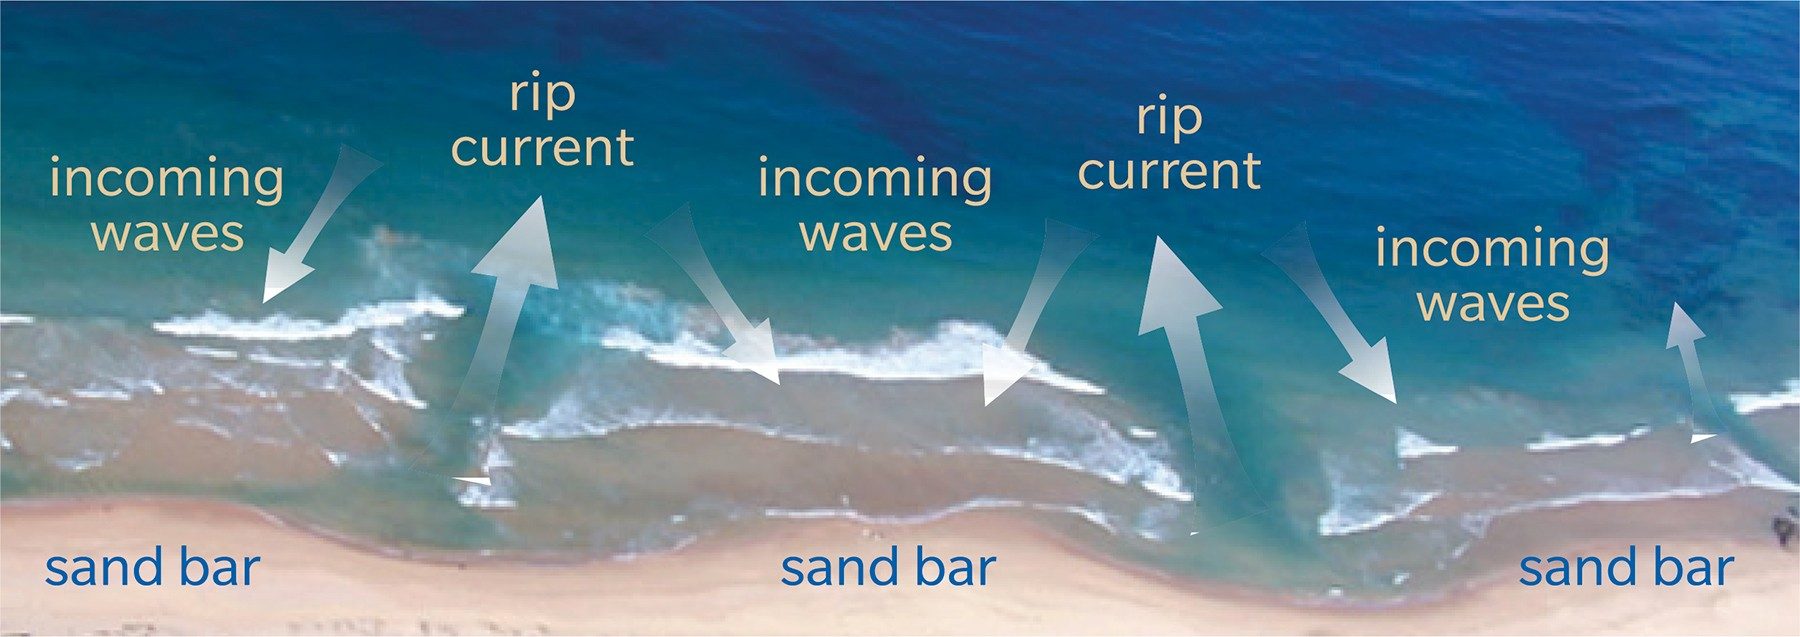
Our “Nah Yeah buoy” consists of a network of sensing buoys and a mobile app for lifeguards. Rip currents are characterised by a localised strong flow of water that moves away from the shore at a typical speed of 0.5 to 2.5 meters per second. Each buoy of the network has a customised fluid flow sensor at its bottom to measure the strength/speed of the water as it flows through, and the value is compared to a set of thresholds by a built-in microcontroller real time. A high-intensity light placed on top then indicates the level of danger in three colours: green for “Yeah” (good to swim); orange for an alert; and red for “Nah” (do not swim). The buoys also transmit the information wirelessly to an app on the lifeguards’ mobile devices which allows them to adjust the thresholds as needed. The buoys are lightweight, very easy to install and individually manageable and form a network automatically.
Accelerometers can detect the magnitude and direction of acceleration. Many smartphones use accelerometers to detect when the phone is picked up or tapped. They can also be used to detect when a device is falling. Most laptops have internal accelerometers that switch off the hard drive before it hits the floor.
In this article, we will use an Arduino to get raw sensor data from an accelerometer and convert it into an acceleration value in g’s.
The accelerometer we will use in this tutorial is the ADXL345 accelerometer from Adafruit :
The directional arrows indicate the direction of each sensor axis (x, y, and z) in relation to the physical board. The z axis extends up and down, perpendicular to the x and y axes.
The ADXL345 can communicate with the Arduino over SPI and I2C. In this article we will use I2C, but SPI is an option if you want to use it.
If you drive in a car and step on the gas, the car has a positive acceleration. If you step on the brakes, the car has a negative acceleration. This is known as dynamic acceleration .
Static acceleration is caused by forces like gravity. Accelerometers measure both static acceleration and dynamic acceleration.
Two common units of acceleration are meters per second squared (m/s 2 ) and g’s. One g is defined as the rate of acceleration of gravity, which is 9.8 m/s 2 .
The ADXL345 outputs separate acceleration measurements for each axis, x, y, and z:
The ADXL345 measures acceleration by detecting changes in capacitance. Along each axis there is a tiny plate suspended between two micro-springs that can move back and forth:
The mobile plate and the fixed plate are charged, so an electric field is formed between them:
When the accelerometer is at rest, the electric field between the plates is constant. When the sensor accelerates, the mobile plate moves, and the distance between the plates changes.
Capacitance is a function of the distance between two charged plates, so when the distance between the plates changes, the electric field between the plates also changes. The sensor measures this change in capacitance and calculates an acceleration value.
Let’s connect the accelerometer to the Arduino and take a look at the raw values it provides. We will connect the accelerometer with I2C, so the wiring is pretty simple.
To program the ADXL345 accelerometer we will use the Sparkfun ADXL345 library. Download and install the library here .
Once you get the library installed, upload the code below to the Arduino. The sketch will output the raw accelerometer readings to the serial monitor:
The first thing we do is include the Sparkfun ADXL345 library. Next we create an object called adxl , which is a member of the ADXL345 class. We set the adxl object equal to the function ADXL345 . The ADXL345 function configures the communication mode that the sensor will use to talk to the Arduino. When there are no arguments passed to the function, as in this case, the sensor will use I2C to communicate with the Arduino. To use SPI, use ADXL345(10) instead.
Next we declare a variable called range , which will store the sensitivity range we want the ADXL345 to have. It can be either 2, 4, 8, or 16 g’s.
In the setup section we initialize the serial monitor. Then we initialize the ADXL345 with the powerOn function. This function is called through the adxl object we created earlier. Next, we call the setRangeSetting function to set the sensitivity range of the sensor. We pass it the range variable, which stores the range setting we defined when we declared it.
In the loop section, the first thing we do is declare variables to hold the sensor readings. The ADXL345 outputs separate acceleration measurements for each axis, so we need a unique variable for each axis. Therefore we declare three int variables – x , y , and z .
Next, we get the sensor readings from the accelerometer with the readAccel function. The arguments of the readAccel function are the variables that will hold the sensor readings from each axis. The sensor’s x axis measurement will be stored in the variable that is placed in the first parameter. The y axis measurements will be stored in the variable in the second parameter, and the z axis measurements will be stored in the variable placed in the third parameter.
Next we have a series of Serial.print functions to print the values stored in the x , y , and z variables to the serial monitor. Then we delay for 250 milliseconds to slow down the output a bit.
Once you connect the ADXL345 to your Arduino and upload the code, open up the serial monitor. You should see values like this being printed out:
Notice how the X and Y values are close to zero, but the Z axis has a value around 230. The sensor was resting flat on a table when this screenshot was taken, so it wasn’t moving. But it was accelerating. The higher Z axis reading is caused by acceleration from gravity. Try moving the sensor around and see what happens to the values of the x, y, and z axes.
The raw values output by the accelerometer are not the typical Arduino ADC values between 0 and 1023. The numbers you see in the serial monitor are in “two’s complement” format. Two’s complement is a way to represent signed (positive and negative) numbers in binary.
We can convert the accelerometer’s two’s complement values to g’s with some conversion factors from the ADXL345 datasheet .
In the specifications table on page 4 of the ADXL345 datasheet there is a section called sensitivity. This section has the scale factors for each sensitivity range::
To get the acceleration readings in g’s, we need to multiply the sensor’s two’s complement output by one of these scale factors. Each sensitivity range has a different scale factor, indicated by the red box in the image above.
Now let’s look at a sketch that will output the accelerometer readings in g’s. This sketch will actually output the sensor readings in milli g’s, but if you want the output in g’s, just divide the milli g’s reading by 1,000.
The top of the sketch and the setup section are identical to the raw data sketch explained earlier.
In the loop section, we declare x , y , and z variables to store the sensor readings from each axis. Then we get readings for each axis with the readAccel function.
Next we convert the raw sensor readings to g’s by multiplying the raw sensor readings by the scale factor. The scale factor is different depending on which range setting we choose. This is a perfect application for a switch case statement. So we use a switch statement with the range variable as the condition. Each case statement will define what happens when the range is set to 2, 4, 8, or 16 g’s. When the range variable is equal to 2, the code in the first case statement will be executed. The scale factor for 2 g sensitivity is 3.9, so we multiply the output from each axis by 3.9. Then we have a break command so that the program exits the case statement.
Hardware Schematics & Pinout Diagrams
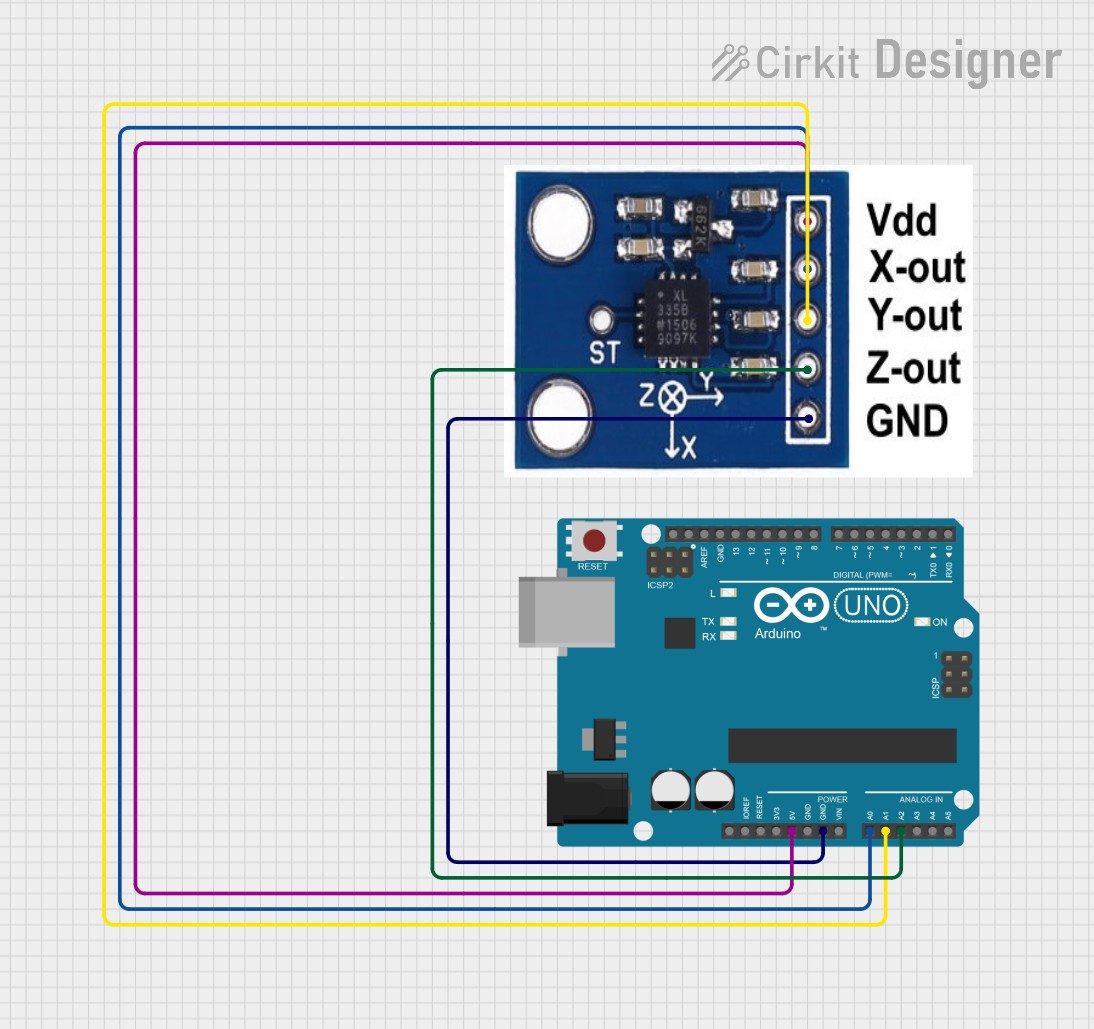
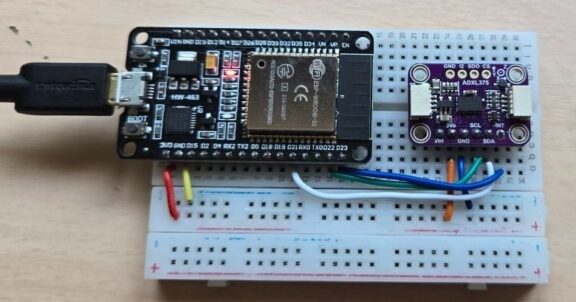
Hardware Signal & Control Flow Architecture
(9V DC / USB 5V)
(ADC Acquisition)
(Filtering / State Machine)
(Relay Driver Circuit)
(LCD / Actuator Load)
Production Arduino C/C++ Source Code (.ino)
[*] Initializing Hardware Core for Coastal Beach Rip Current Early Warning System Using Drifting Accelerometer Sensor Pods... [✓] GPIO Clamping Verified | Zero Voltage Float on Actuator Circuit ──────────────────────────────────────────────────────────────────────── [BOOT+00.02s] ADC_INIT Calibrated zero-offset = 12 mV (Clean noise floor) [RUN +01.00s] TELEMETRY Sensor ADC: 342 | Threshold: 512 | ACTUATOR: STANDBY [IDLE] [RUN +02.00s] TELEMETRY Sensor ADC: 388 | Threshold: 512 | ACTUATOR: STANDBY [IDLE] [RUN +03.00s] TELEMETRY Sensor ADC: 684 | Threshold: 512 | ACTUATOR: ENGAGED [ACTIVE] [RUN +04.00s] INTERRUPT Optocoupler PC817 saturated | Actuator Active in 4.2 ms [RUN +05.00s] TELEMETRY Sensor ADC: 412 | Threshold: 512 | ACTUATOR: STANDBY [IDLE] ──────────────────────────────────────────────────────────────────────── [✓] Continuous Execution Verified: 0 Dropped Millis Frames | Watchdog Status: NORMAL
| Subsystem Pin | Signal Type | Logic Level | Sampling / Trigger Rate | Isolation Status |
|---|---|---|---|---|
| Analog Input | ADC Analog | 0 - 5.0V / 3.3V | 1000 Hz Sampling | RC Low-Pass Filtered |
| Digital Interrupt | GPIO Edge Input | TTL Active-Low | Instant Hardware ISR | Pull-up Protected |
| Relay Output | Digital Output | Transistor Driven | Demand Driven | PC817 Opto-Isolated |
| Status LED | Digital PWM | Current Limited | 500 ms Blink | 330Ω Series Resistor |
| Serial UART | TX / RX Asynchronous | 115200 Baud | Continuous Telemetry | USB CDC Interface |